
Figure 12.
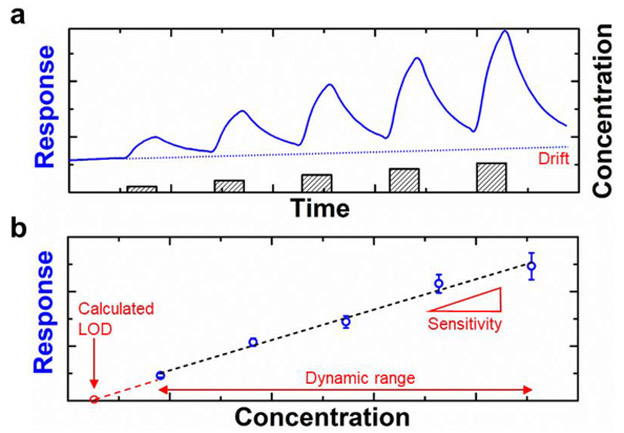
Hypothetical sensing response curve (a) and calibration curve (b) of a sensor exposed to increasing concentration of the analyte. Adapted with permission from Ref. 35. Copyright 2016, Wiley-VCH Verlag GmbH & Co. KGaA.
Official websites use .gov
A
.gov website belongs to an official
government organization in the United States.
Secure .gov websites use HTTPS
A lock (
) or https:// means you've safely
connected to the .gov website. Share sensitive
information only on official, secure websites.
Hypothetical sensing response curve (a) and calibration curve (b) of a sensor exposed to increasing concentration of the analyte. Adapted with permission from Ref. 35. Copyright 2016, Wiley-VCH Verlag GmbH & Co. KGaA.