Figure 12.

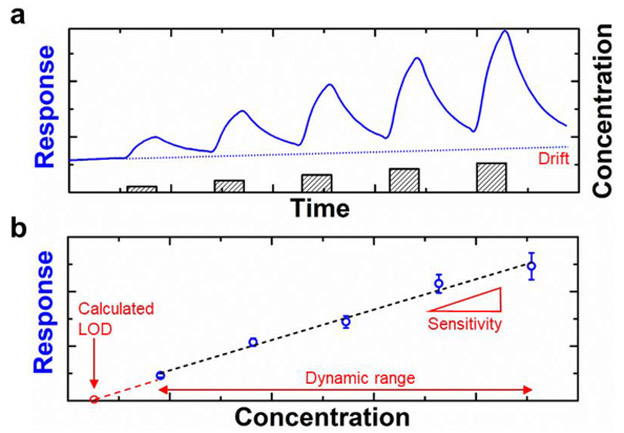
Hypothetical sensing response curve (a) and calibration curve (b) of a sensor exposed to increasing concentration of the analyte. Adapted with permission from Ref. 35. Copyright 2016, Wiley-VCH Verlag GmbH & Co. KGaA.

Hypothetical sensing response curve (a) and calibration curve (b) of a sensor exposed to increasing concentration of the analyte. Adapted with permission from Ref. 35. Copyright 2016, Wiley-VCH Verlag GmbH & Co. KGaA.