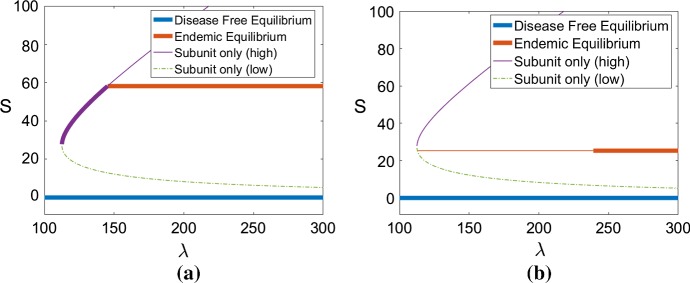
Fig. 3.
Bifurcation diagram obtained for the steady-state subunit populations S when the monomer source, , varies for two values the polymerization rate . The other parameters are set as in Table 1 (Strain 1). The four different equilibria are depicted (disease-free equilibrium, endemic equilibrium, higher subunit only equilibrium , lower subunit only equilibrium ). A thin line indicates an unstable equilibrium, whereas a bold line indicates a locally stable equilibrium. a, b

