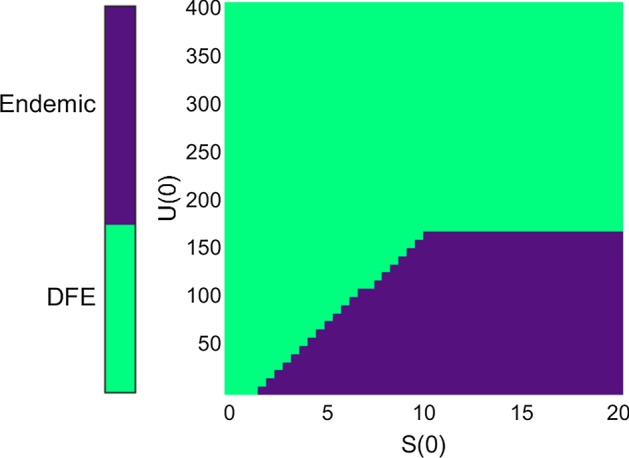
Fig. 7.

Representation of the basins of attraction of the endemic steady-state (dark color) and the disease-free steady-state (lighter color), according to the initial condition. The horizontal axis represents the initial number of subunits, and the vertical axis represents the initial number of aggregates. The parameters used are those of Strain 1 in Table 1, the initial value for V is set to (disease-free value), and the initial value for P is set to (steady-state mean size)
