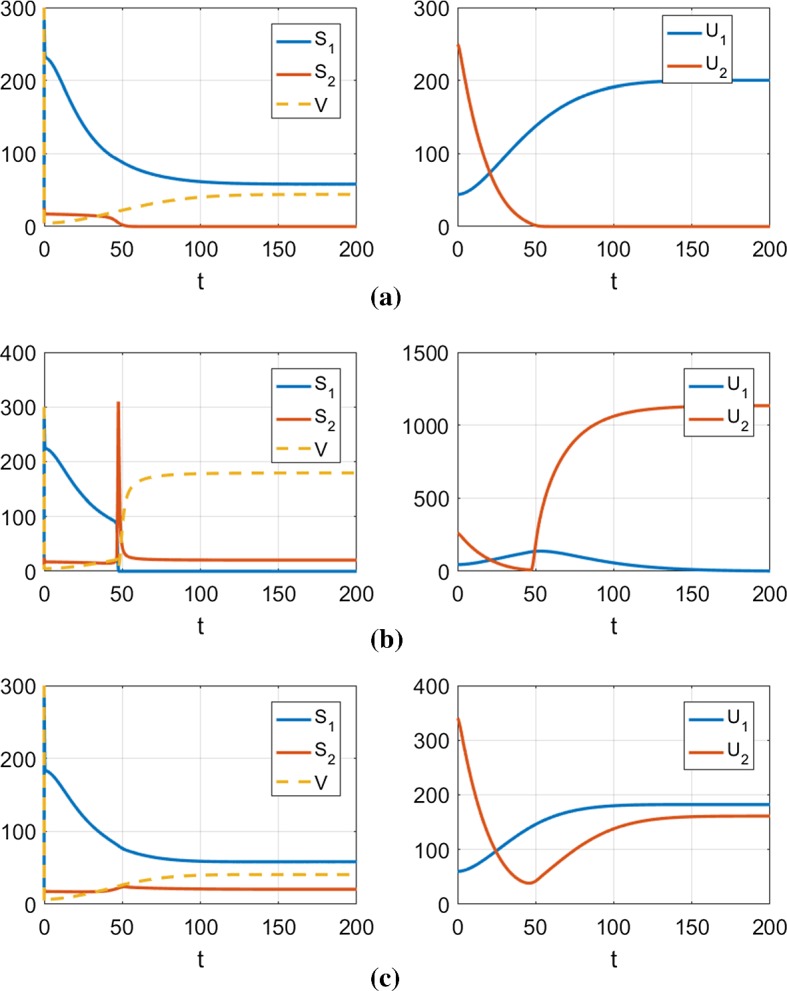
Fig. 9.

Illustrations of typical cases from the diagram shown in Fig. 8, representing the time evolution of the two strains (blue line is Strain 1, orange line is Strain 2). The parameters used are shown in Table 1. In each case, V is initialized to the disease-free steady-state , and the strains are initialized with the specified conditions. The top panel (a) shows takeover of Strain 1, the middle panel (b) shows takeover of Strain 2, whereas the bottom panel (c) shows asymptotic coexistence of both strains a and , b and c and
