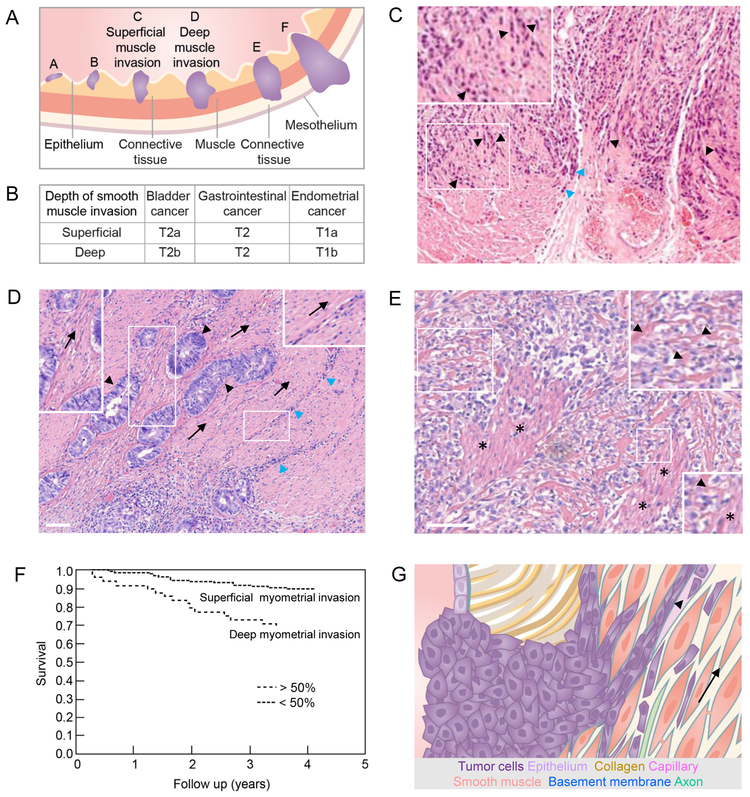
Figure 2: Overview, histopathology and impact of smooth muscle neoplastic invasion.
(A) Hollow organs such as bladder, gastrointestinal tract and uterus lined by epithelium, connective tissue and smooth muscle layers (muscularis mucosa and muscularis propria) when invaded by tumors (purple) at their onset (A,B), during superficial (C) and deep muscle invasion (D), and when ultimately reaching connective and fatty tissue of nearby organs (E,F). (B) Tumor - Lymph Node - Metastasis (TNM) staging of primary tumors from the indicated neoplasias as defined by the American Joint Committee on Cancer, with T1 defining the smallest, and T4 defining the greatest local extent of the primary tumor. The depth of muscle invasion differentiates tumors into different T-sub-stages, depending on the tumor type [98]. (C) Bladder cancer cell invasion (purple) in chain-like fashion into surrounding smooth muscle tissue (black arrowheads and inset) or along connective tissue (blue arrowheads). Image reprinted with permission from Springer Nature; [40]. (D) Colorectal cancer bud formation (black arrowheads) and immune infiltration (blue arrowheads) along the orientation (arrows; also see insets) of the smooth muscle layer of the colon. (E) Muscle destruction in the anus caused by advanced colorectal cancer disease (also see insets; arrowheads point to remnant muscle structures; asterisks indicate partly remaining muscle). (F) Deep cancer invasion of the myometrium surrounding the uterus is associated with significantly (P <0.0001) decreased overall survival and thus serves as a prognostic parameter. Two hundred and two patients with <50% myometrial invasion and 49 patients with myometrial invasion exceeding 50%. Image modified and reprinted with permission from John Wiley and Sons; [45]. (G) Schematic representation of tumor cell guidance by smooth muscle tissue. Guiding structures for migrating tumor cells (in the direction of the arrow) include endomysium and basement membranes of muscle cells, axons and capillaries as well as the lumen of capillaries (arrowhead). Colored structures are identical to their annotation in Fig. 1A and C. All scale bars, 100 µm.

