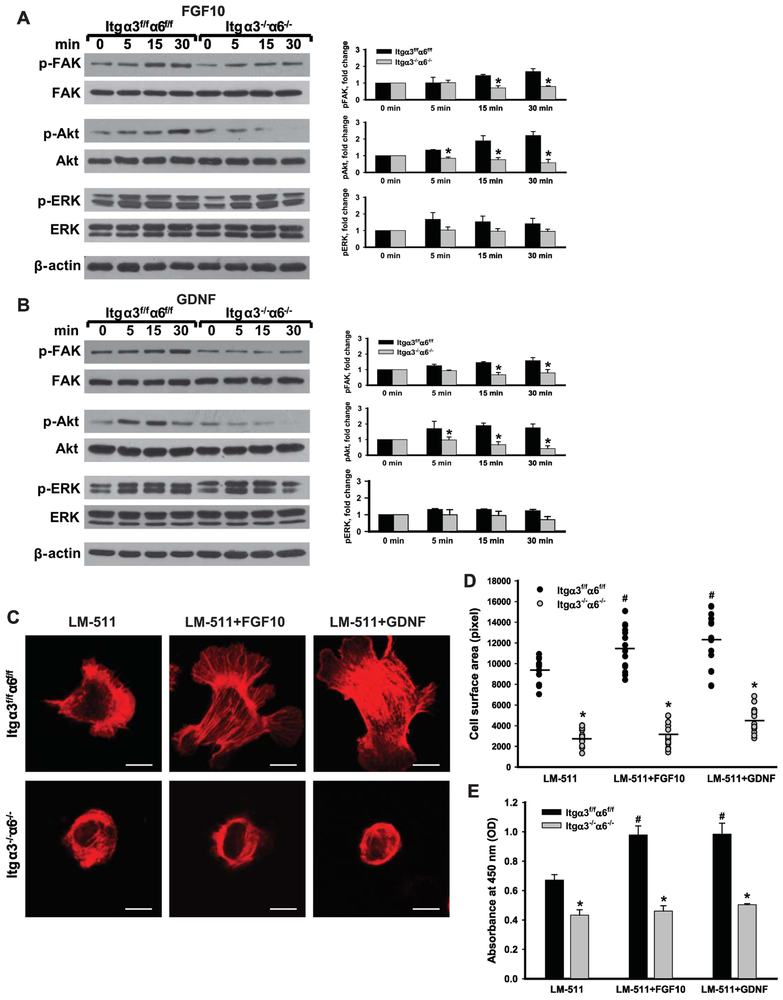
Figure 3. Integrin subunits α3 and α regulate FGF10- and GDNF-dependent Akt activation, cell spreading and proliferation on LM-511.
(A-B) Itgα3f/fα6f/f and Itgα3−/−α6−/− CD cells were plated on LM-511 for 1 h, treated with FGF10 (A) or GDNF (B) (10 ng/ml each) and lysed 5, 15 and 30 min after addition of growth factors. Cell lysates were subjected to immunoblot analysis for phospho- FAR, Akt and ERK1/2; β-actin was used as loading control. Levels of phosphorylated proteins were measured by densitometry, normalized to total protein and β-actin levels, and expressed as fold-change relative to the “0” time point. Values are the mean and ±SEM of 3-5 independent experiments; *p≤0.05 between Itgα3f/fα6f/f and Itgα3−/−α6f/f CD cells at the corresponding time point. (C-E) Itgα3f/fα6f/f and Itgα3−/−α6−/− CD cells were plated on LM-511 for 1 h and treated with FGF10 or GDNF (10 ng/ml each). Cell spreading (C-D) and proliferation (E) were evaluated at 1 and 24 h after addition of growth factors. (C) Representative confocal images of the cells stained with rhodamine-phalloidin; bar: 10 μM. (D) The individual measurements of cell surface (in pixels) of 15-30 cells with the mean is shown; *p≤0.05 between Itgα3f/fα6f/f and Itgα3−/−α6f/f CD cells. # ≤0.05 between Itgα3f/fα6f/f untreated or treated with FGF10 or GDNF (E) Proliferation as measured by the OD of BrdU-positive cells ±SEM of 4-6 independent experiments is shown; *p≤0.05 between Itgα3f/fα6f/f and Itgα3−/−α6f/f CD cells; # p≤0.05 between Itgα3f/fα6f/f untreated or treated with FGF10 or GDNF.

