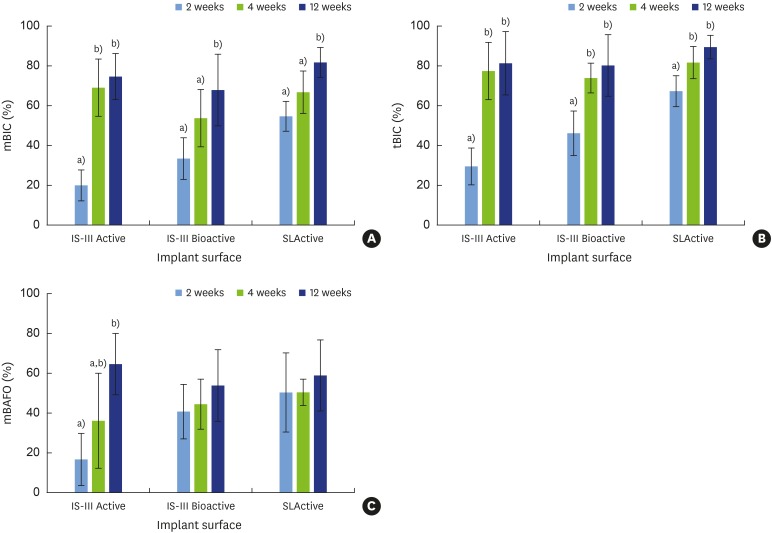
Figure 7. Bar graphs of mBIC, tBIC, and mBAFO for different implant surfaces after 2, 4, and 12 weeks of healing. Red, yellow, and green bars indicate 2, 4, and 12 weeks of healing, respectively. The X-axes represent the implant surface. (A) mBIC, (B) tBIC, and (C) mBAFO values for different implant surfaces with 2, 4, and 12 weeks of healing.
mBIC: mineralized bone-to-implant contact, tBIC: total bone-to-implant contact, mBAFO: mineralized bone area fraction occupied.
a,b)Statistically significant difference among 2 weeks, 4 weeks and 12 weeks of healing in each implant surface (adjusted P<0.0056).

