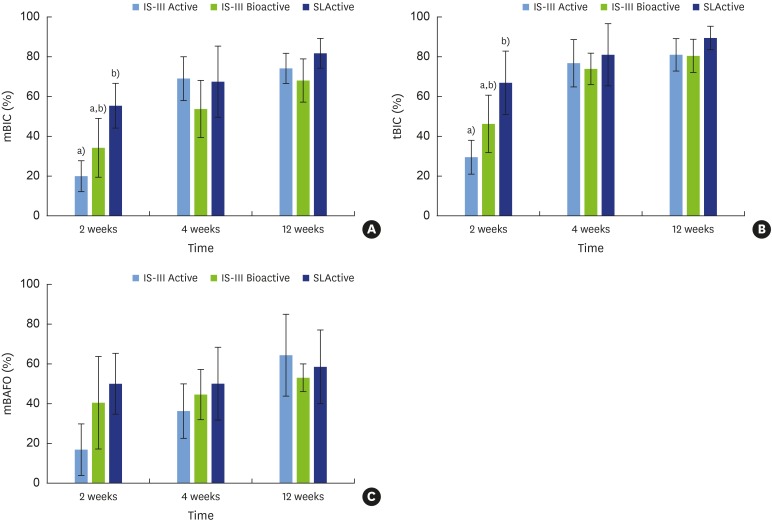
Figure 8. Bar graphs of mBIC, tBIC, and mBAFO for 2, 4, and 12 weeks of healing with 4 different implant surfaces. Orange, blue, and purple bars indicate IS-III Active, IS-III Bioactive, and SLActive implant surfaces, respectively. The X-axes represent healing time. (A) mBIC, (B) tBIC, and (C) mBAFO values for 2, 4, and 12 weeks of healing with different implant surfaces.
mBIC: mineralized bone-to-implant contact, tBIC: total bone-to-implant contact, mBAFO: mineralized bone area fraction occupied.
a,b)Statistically significant difference among implant surfaces for each healing time (adjusted P<0.0056).

