Figure 3.

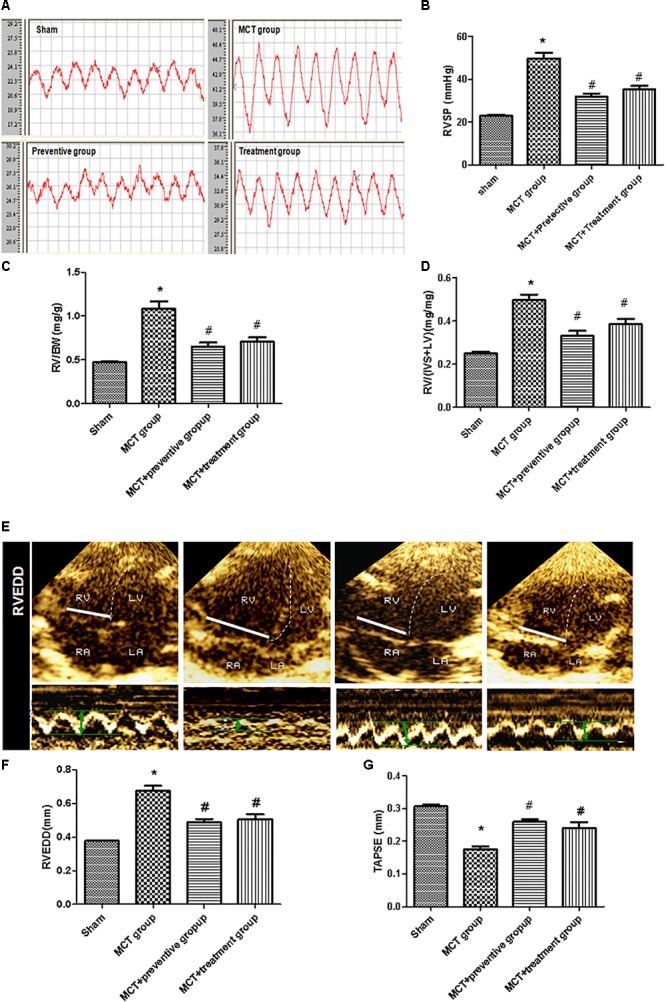
Inhibition of MCT-induced increase in right ventricular systolic pressure, hypertrophy, enlargement, and dysfunction by PNU-282987. (A) The representative right ventricular hemodynamic waves are presented in the sham, MCT, prevention, and treatment groups. (B) Right ventricular systolic pressure (RVSP) was determined. (C,D) RV hypertrophy was determined by RV weight normalized to body weight (BW) and the ratio of RV/[Left ventricle (LV) + septum (S)] among the four groups, respectively. (E) RV end diastolic dimension (RVEDD) and tricuspid annular plane systolic excursion (TAPSE) measured by echocardiography. (F,G) Comparison of the RVEDD and TAPSE by echocardiography in different groups. The data are summarized as means ± SD. ∗P < 0.05 versus the sham group and #P < 0.05 versus the MCT group. Results shown are from one experiment (sham group, n = 15; MCT group, n = 8; MCT+protective group, n = 13; MCT+treatment group, n = 11).
