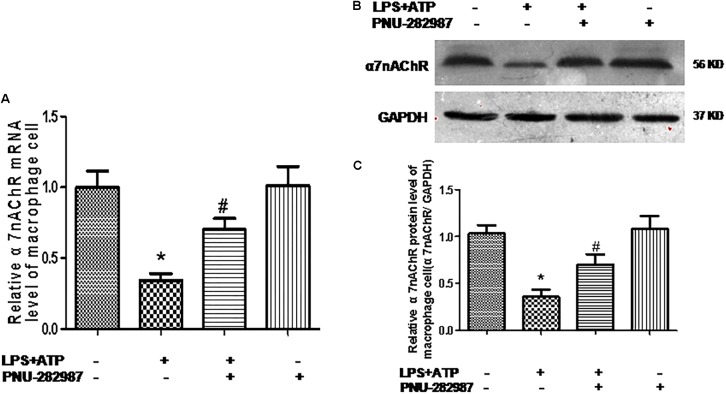
Figure 7.
PNU-282987 treatment activation of α7nAChR mRNA and protein in lung macrophages. (A) Fluorescence quantitative real-time polymerase chain reaction (RT-PCR) showing the relative level of α7nAChR mRNA in lung macrophages treated with or without LPS+ATP, and PNU-282987. (B) Representative western blot showing the expression of α7nAChR (56 kDa) protein in lung macrophages treated with or without LPS+ATP, and PNU-282987. (C) Relative protein levels of α7nAChR were determined after normalization to GAPDH. LPS, lipopolysaccharide; ATP, adenosine-triphosphate. Data were accumulated from three independent assays. The data are expressed as means ± SD. ∗P < 0.05 versus the control cells and #P < 0.05 versus LPS+ATP cells.

