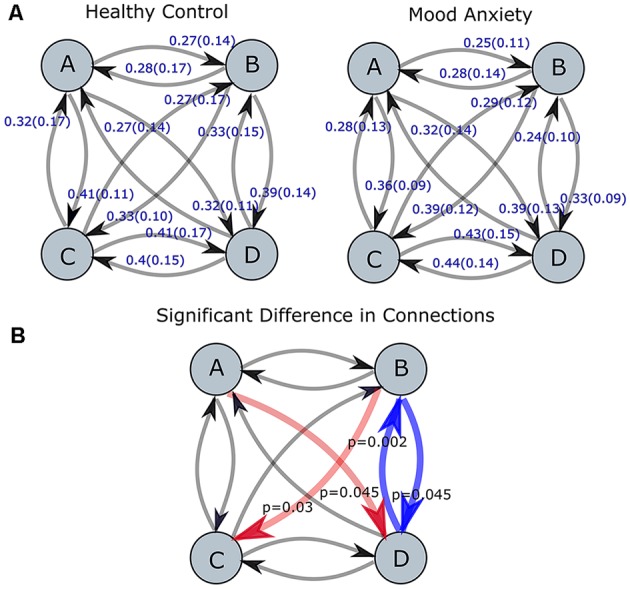
Figure 4.

Transition probabilities for MA and HC groups are shown in part (A). The red and blue arrows (red represent an increase, while blue represent a decrease for MA group as compared to HC one) in part (B) represent the connections with the statistically significant difference between two groups (p-values corrected for multiple comparisons using Bonferroni-Holm). The level of significance was set to p < 0.05.
