
Figure 6.
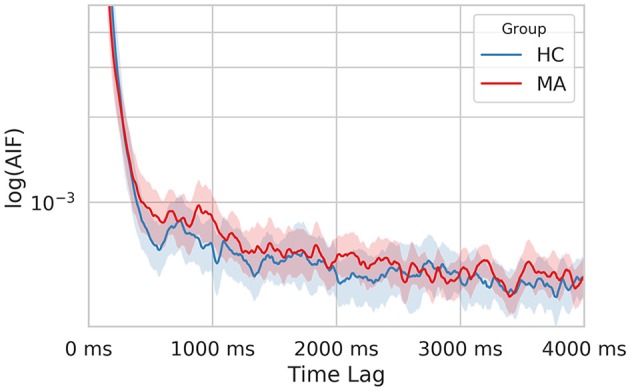
The semi-log time-lagged mutual information plot for the MA and HC groups at different time lags. The shaded area represents the 95% confidence intervals for each group.
Official websites use .gov
A
.gov website belongs to an official
government organization in the United States.
Secure .gov websites use HTTPS
A lock (
) or https:// means you've safely
connected to the .gov website. Share sensitive
information only on official, secure websites.
The semi-log time-lagged mutual information plot for the MA and HC groups at different time lags. The shaded area represents the 95% confidence intervals for each group.