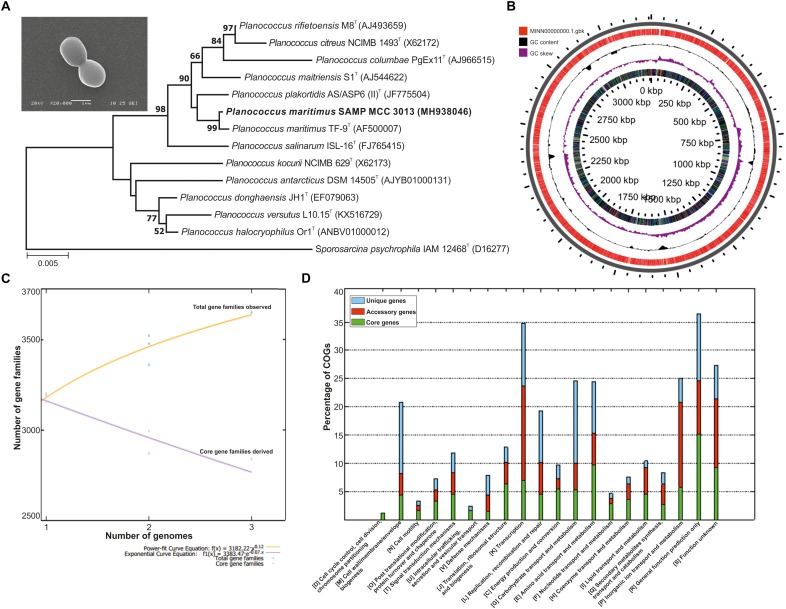
FIGURE 1.
(A) Phylogenetic tree reconstructed by a neighbor-joining analysis based on 16S rRNA gene sequences, depicting the phylogenetic relationship of strain SAMP to related type strains of the genus Planococcus Bar, 0.005 changes per nucleotide position. Bootstrap values (%) >50% from 1,000 replicates are shown and inset showing scanning electron micrograph (SEM) of P. maritimus SAMP MCC 3013. (B) Circular genome plots. The outermost concentric circles denote the predicted protein-coding genes present in both forward strand and the reverse strand. The next concentric represents the GC content and the purple color show the GC content below average. (C) The numbers of shared genes were plotted as a function of number of strains. (D) COG distribution in core, accessory and unique genomes.

