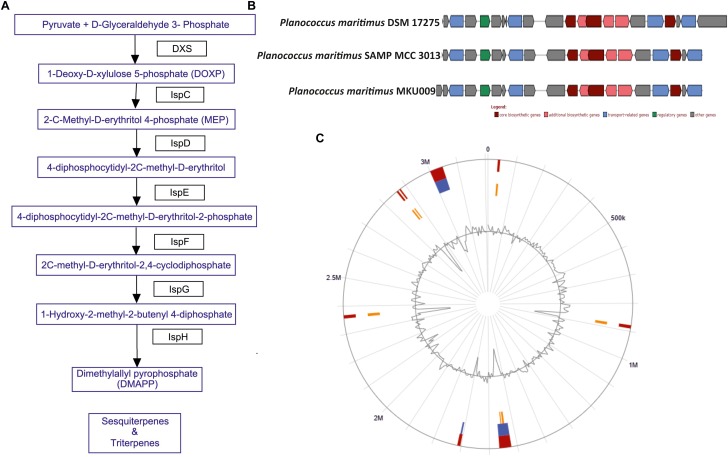
FIGURE 2.
(A) The biosynthetic pathway found in the strain P. maritimus SAMP for terpenoid production. (B) Comparison of terpene biosynthesis gene cluster with the available genomes. (C) Genomic island of SAMP. Red color defines predicted genomic islands using integrated method. The blue color shows genomic islands predicted by IslandPath-DIMOB while yellow color shows genomic islands predicted by SIGI-HMM method. The broken lines represent scaffolds borders.

