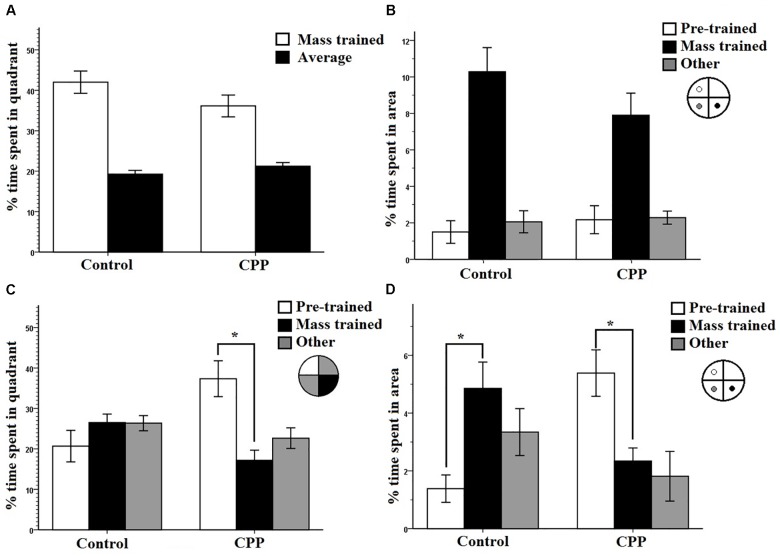
FIGURE 3.
(A) A 30-s probe test immediately after mass training for group 1 in Experiment 1. The percentage of time spent in the mass trained quadrant versus an average of the other three was compared. Both controls and CPP rats displayed a preference for the mass trained quadrant. (B) A 30-s probe test immediately after mass training for group 1 in Experiment 1. The percentage of time spent in the region immediately surrounding the platform locations during pre-training, mass training, and a non-trained area were compared. Both controls and CPP rats displayed a preference for the area surrounding the mass trained platform. (C) A 30-s probe test 8 h after mass training for group 1 in Experiment 1. The percentage of time spent in the pre-trained quadrant, mass trained quadrant and the average of the other two was compared. Controls displayed no preference whereas CPP rats displayed a preference for the pre-trained quadrant. (D) A 30-s probe test 8 h after mass training for group 1 in Experiment 1. The percentage of time spent in the region immediately surrounding the platform locations during pre-trained, mass trained and a non-trained area were compared. Controls displayed a preference for the area immediately surrounding the mass trained platform whereas CPP rats displayed a preference for the area surrounding the pre-trained platform. Error bars 1 ± SE, ∗p < 0.05.

