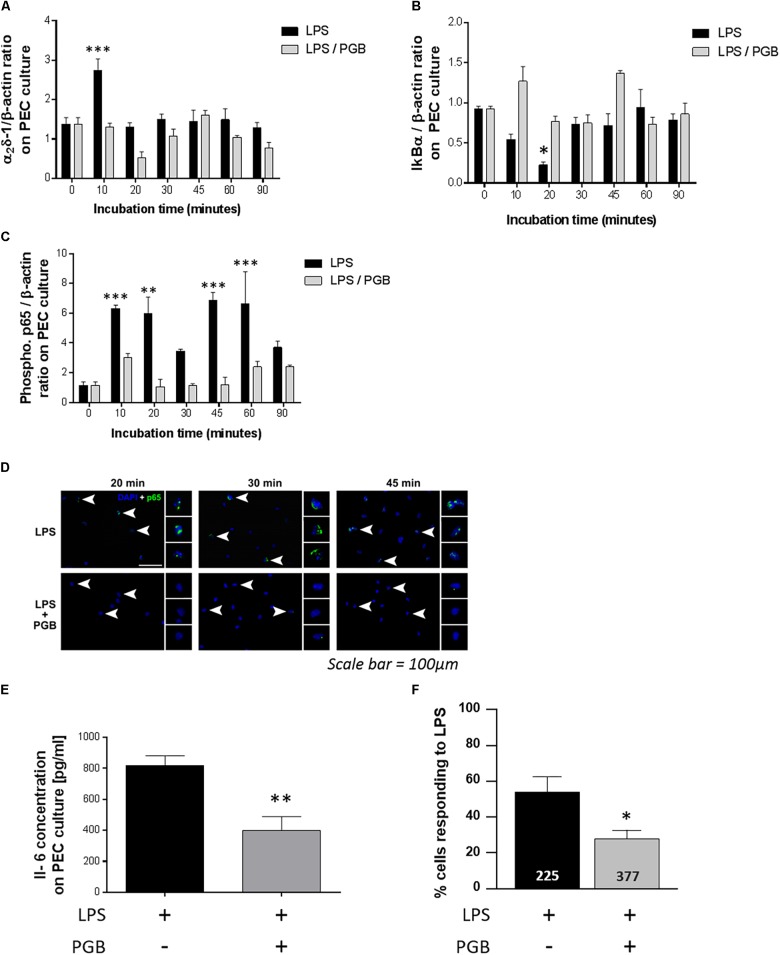
FIGURE 4.
Effect of PGB (11.3 μM) on α2δ-1 subunit (A) IκBα (B), and phospho-p65 (C) expression in resident peritoneal exudate cells (PECs) stimulated with LPS (100 ng ml-1). The expression was measured 10, 20, 30, 45, 60, and 90 min after LPS with or without PGB treatment by western blot analyses (n = 4/condition). Intracellular localization of p65 in LPS-stimulated (100 ng ml-1) PEC treated or not with PGB (11.3 μM) was visualized by immunohistochemistry. Arrowheads indicate cells which are magnified in side panels (scale bar: 100 μm). (D) Effect of PGB on IL-6 level in resident PECs stimulated with LPS 24 h after these treatments (n = 4/group). (E) Percentage of LPS-stimulated PECs having [Ca2+]i increase when incubated with saline solution or PGB (11.3 μM). (F) A single PEC was considered as a responder if the F340/F380 ratio for a single PEC increased by 0.05. The number of analyzed cells is shown at the bottom of the histograms (225 cells for the LPS condition and 377 cells for the LPS + PGB condition). The values are expressed as a mean ±S.E.M. and compared by a 2-way ANOVA (Model, Treatment) followed by Bonferroni post hoc test for multiple comparisons for α2δ-1, IκBα and phospho-p65 ∗p < 0.05, ∗∗p < 0.01, ∗∗∗p < 0.001 vs. t0 and by a 1-way ANOVA (Treatment) followed by Tukey post hoc test for multiple comparisons for IL-6 and intracellular calcium concentration analyses ∗p < 0.05, ∗∗p < 0.01, ∗∗∗p < 0.001 vs. LPS treated group.

