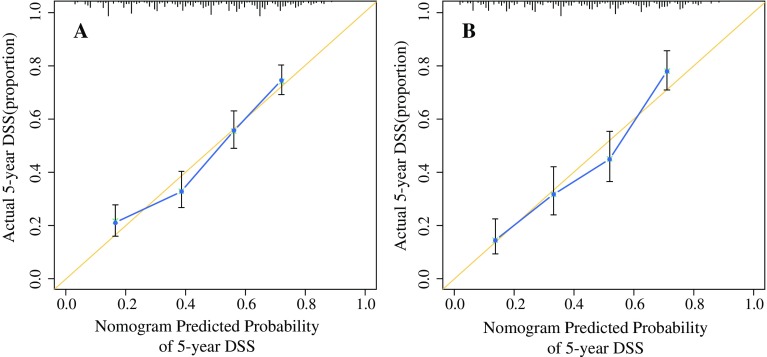
Fig. 2.
Calibration curves for predicting 5-year DSS for patients with non-metastatic ampullary carcinoma who were treated with surgery. The nomogram-predicted DSS probability is plotted on the x-axis, and the observed DSS is plotted on the y-axis. a Calibration curve for predicting patient survival at 5 years in the training dataset and b in the validation dataset. DSS disease-specific survival

