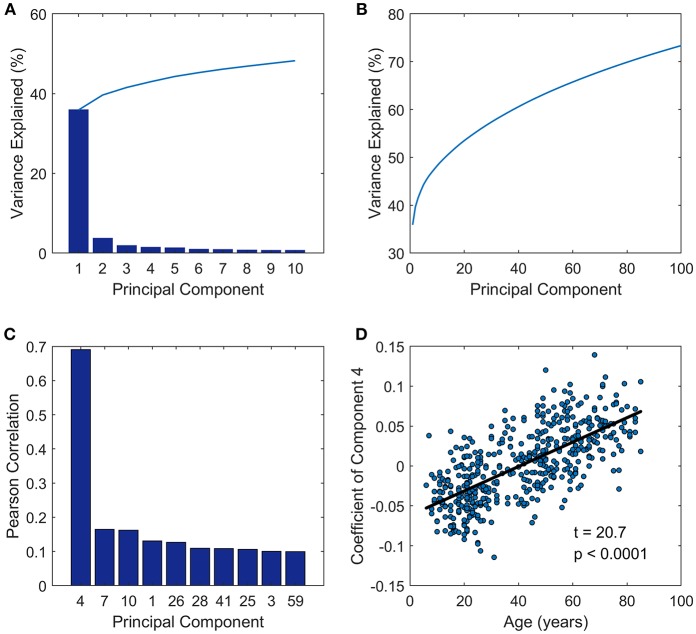
Figure 1.
Principal component analysis results. (A) Variance explained by the first 10 components. (B) Variance explained by the first 100 components. (C) The first ten components which were most closely correlated with age. (D) The coefficients of PC 4 across subjects (y-axis) vs. ages of subjects (x-axis) fitted by a linear regression model.

