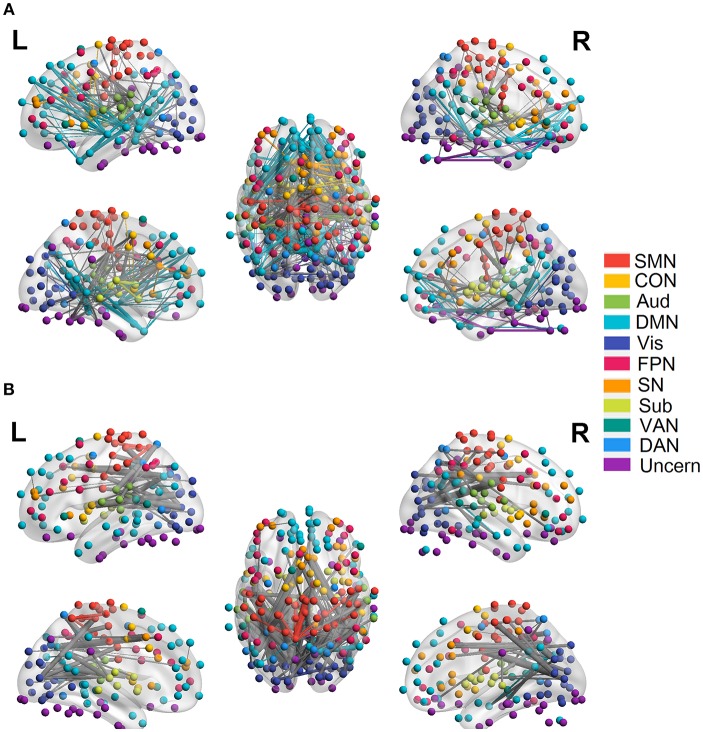
Figure 4.
Linear relationship between functional connectivity and age at the edge level (p < 0.0001, FDR corrected). (A) Significant edges linearly decreasing with age. (B) Significant edges linearly increasing with age. Different color refers to different networks. If two nodes of the edge have same color, that is, they belong to the same network, the edge will be set as the same color. Otherwise the edge will be colored gray. The edge size is scaled by its T-statistics.

