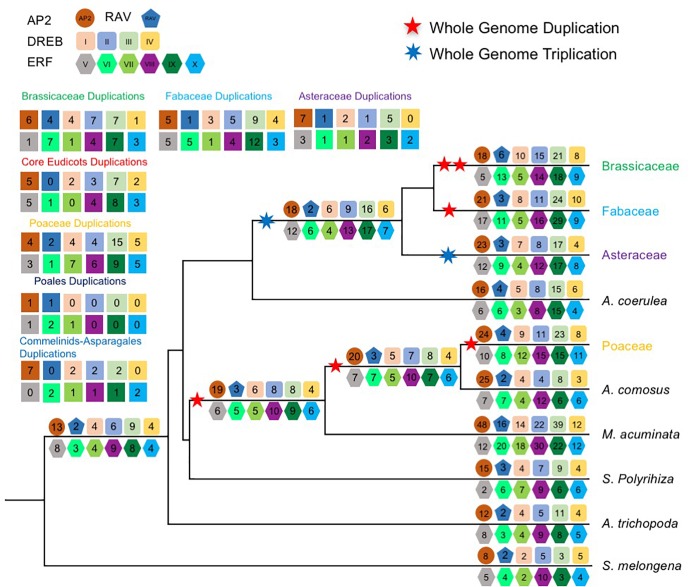
FIGURE 2.
Duplication events inferred from gene trees. Schematic representation of the minimum inferred AP2/ERF protein complement and gene duplication events in the last common ancestor of each major plant group. A numbered geometry represents the copy number in each AP2/ERF subfamily. The numbers in the top and left geometries represent the minimum inferred gene duplication events in the last common ancestor of each major angiosperm groups. Duplication events were inferred from gene trees and species tree.

