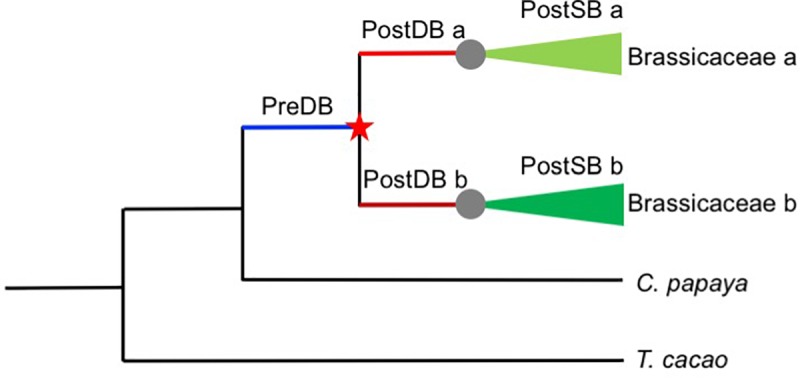
FIGURE 6.

Schematic representation of the AP2/ERF gene duplication data sets employed in this study. Red star indicates a duplication event and gray circles speciation event. Pre-duplication branch (PreDB), Post-duplication branch (PostDB), and Post-speciation (PostSB).
