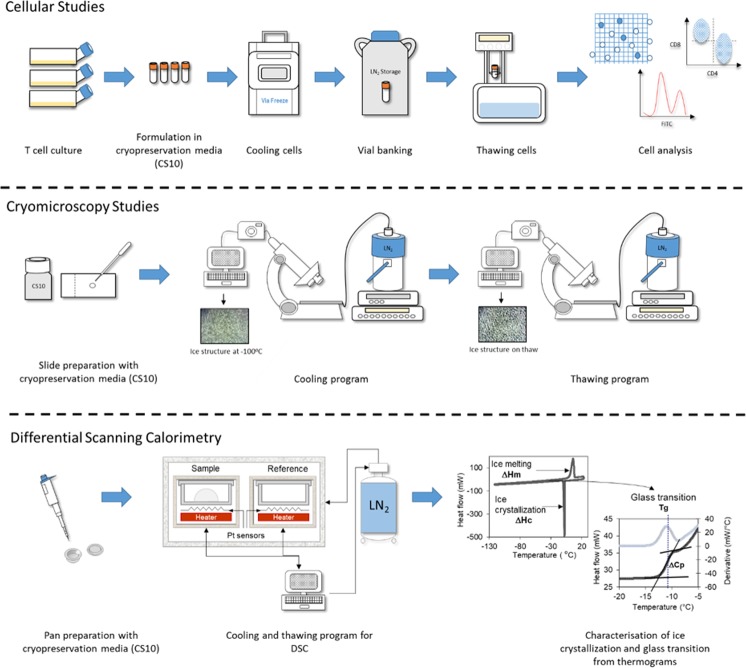
Figure 1.
Schematic representation of the cellular studies, cryomicroscopy studies and differential scanning calorimetry conducted. Full details of the methods followed are described in the methods section. For cellular studies T cells were cultured for seven days in T175 flasks and then formulated in CryoStor10 cryopreservation media at 1 × 10⁷ cells mL−1. The cells were frozen down using four cooling rates 0.1 °C min−1 (using a VIA freeze controlled rate freezer), 1 °C min−1, 10 °C min−1 (using a Planer controlled rate freezer) and ~159 °C min−1 (immersed in LN2) and then thawed at four thawing rates: a very slow thaw (in a polystyrene insert), a slow thaw (in air), a standard thaw (in a 37 °C water bath) and a rapid thaw (in a 95 °C water bath). The thawed cells were then analysed using viability, phenotype and proliferation assays to determine the impact on cellular performance. For cryomicroscopy studies CryoStor10 cryopreservation media was added to a microscope slide and this was placed on a microscope with an attached BC196 cold stage system using LN2 cooling. Cooling and thawing protocols were programmed into the cold stage system and by using a camera attached to the optical output of the microscope videos of the whole cooling-thawing process were captured on a laptop and images taken at appropriate time points. A DSC protocol was used for determining the ice crystallization and glass transition temperature of cryopreservation media (CryoStor10) at different cooling and warming rates.

