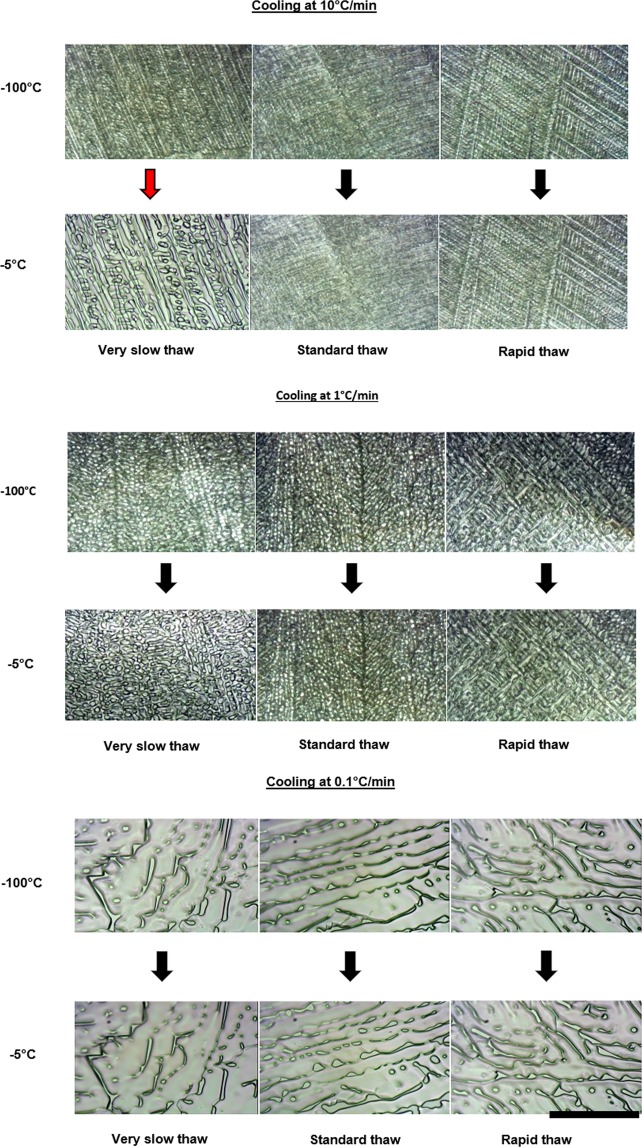
Figure 3.
Ice structure and changes observed during the warming cycle. Each of the three sets show different cooling rates (10 °C min−1, 1 °C min−1, and 0.1 °C min−1 from top to bottom respectively). The upper three images in each set show the ice structure on reaching −100 °C, and the lower three images show the ice structure just prior to melting (at approximately −5 °C). In each set three different warming profiles were carried out. From left to right very slow (in polystyrene), standard (in a 37 °C water bath), and rapid thaws (in a 95 °C water bath). Ice structure changes are shown by the red arrow. The scale bar indicates approximately 100 μm, with each image shown to the same scale.

