Fig. 3.
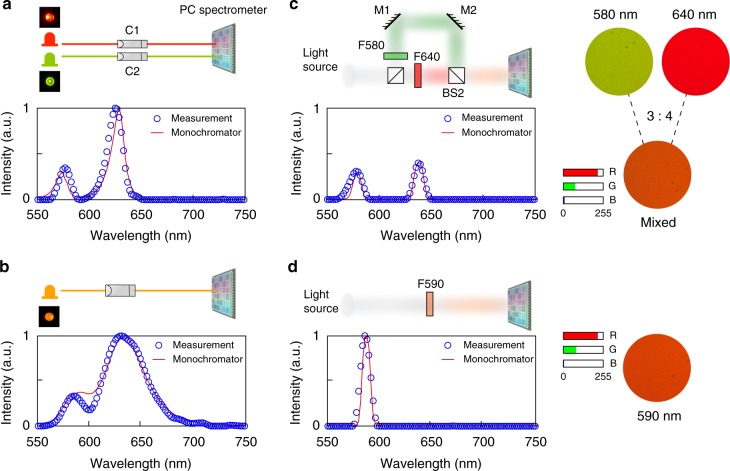
Recovery of broadband spectra. Measurements of a the emission spectrum of a combination of two LEDs (green and red), and b the emission spectrum of a multimode LED (orange/red). C, collimator. c, d Two different spectra appear as the same RGB color. M, mirror; F, filter; BS, beam splitter. c A light beam from a lamp (ASBN-W) is split into two beams, and recombined in a power ratio of 3:4 after passing through two different bandpass filters at 580 ± 5 nm (Thorlabs, FB580) and 640 ± 5 nm (Thorlabs, FB640), respectively. The spectrum of the recombined beam is then analyzed by the PC spectrometer. d Measurements for a white light beam (ASBN-W) passing through a bandpass filter at 590 ± 5 nm (Thorlabs, FB590). For all four cases, the measurement results using the PC spectrometer (circled lines) match well with reference spectra obtained by a commercial monochromator (red solid line)

