Fig. 1.
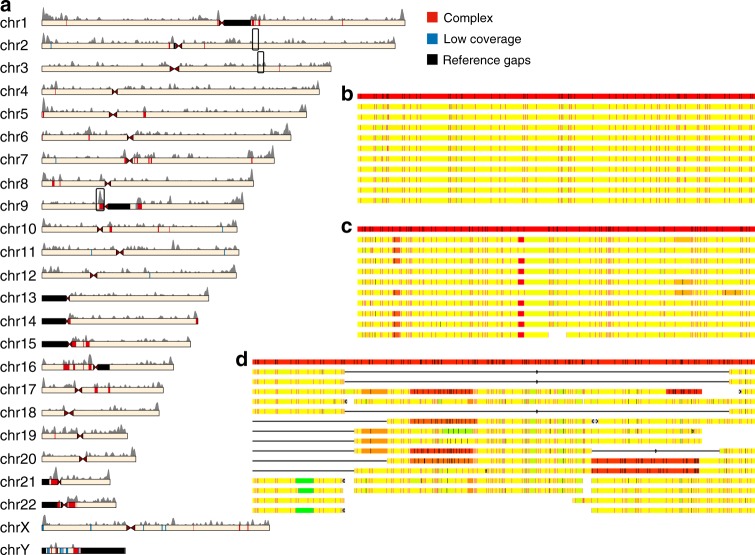
Distribution and properties of large structural variations in the human genome. a Ideogram depicting the distribution of indels and complex regions. The gray histogram above the chromosomes depicts the number of indels detected in all populations using a sliding window of 1 Mb with a 10-kb step size. Chromosome fill shows the different regions classified in the genome. Red, structurally complex regions; blue, low individual assembly coverage; black, regions with long sequence- or nick-based gaps in the reference. For display purposes, both low-coverage and gap regions were only displayed if they were longer than 500 kb. Black boxes enclose areas shown in more detail in b–d. b Alignment of individual sample assemblies to the reference at chr2: 148.4–149 Mb. This region contains a low level of structural variation on the basis of both indel calls and the consensus assembly. c Alignment of individual sample assemblies to the reference at chr3: 38.4–39 Mb. This region contains a high density of indel calls but a low level of complex structural variation, and was categorized as low complexity. d Alignment of individual sample assemblies to the reference at chr9: 42–42.9 Mb. This pericentromeric region has complex structural variation as well as many indels. In b–d, the red bar at top is the reference nick pattern and the bars below are consensus maps from 10 random samples. Yellow segments are highly similar to the reference, while green or red segments are shorter or longer than the corresponding reference segments, respectively, where intensity of color correlates positively with difference from the reference. Red lines represent aligned labels and black lines represent unaligned labels. Circles denote inversions while squares at the ends of contigs denote translocation break ends

