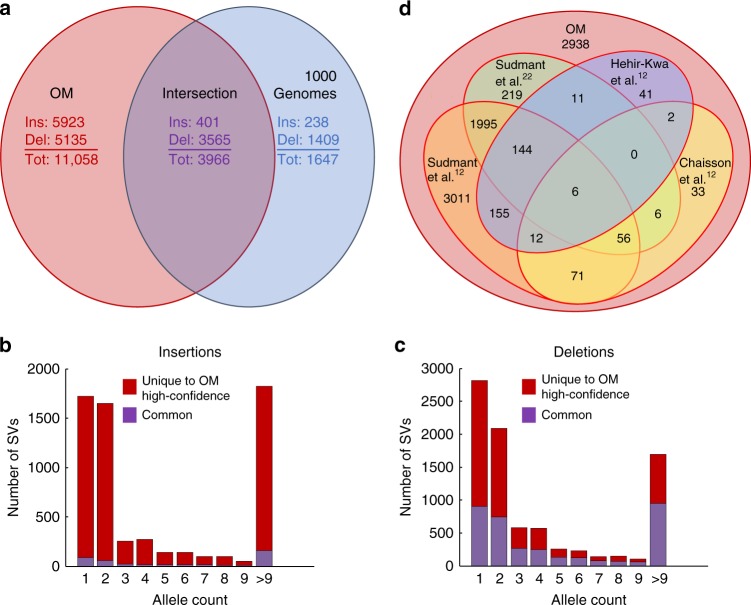
Fig. 2.
Comparisons between the large indels identified by optical mapping (OM) in this study and the ones identified in other large-scale studies. a Number of overlapping and unique large indels identified in our study and Sudmant et al.12 based on the 144 samples commonly studied in the two studies (1KGP). Ins and Del correspond to insertions and deletions, respectively. Tot is the total number of indels in each category. Numbers in red, blue, and purple correspond to numbers of indels identified by OM only, by 1KGP only, and by both, respectively. Since one OMSV may overlap multiple 1KGP SVs, and vice versa, there are actually two sets of numbers in the intersection between the OM set and the 1KGP set. To keep the Venn diagram simple, we have only shown the numbers of indels in the OM set that overlap indels in the 1KGP set. This intersection also contains 406 insertions and 4473 deletions (4879 indels in total) in the 1KGP set that overlap indels in the OM set. b, c Distributions of allele frequencies of the indels uniquely identified by optical mapping (red) and commonly identified in this study and Sudmant et al.12 based on the 144 common samples (purple), considering only insertions (b) and only deletions (c). Since each sample has at most two SV alleles, for an SV with an allele count of x, the number of samples that support this SV is between ⌈x⌉ and x. d Number of large deletions identified by optical mapping that are also identified in any samples in four other studies (see also Supplementary Fig. 27)

