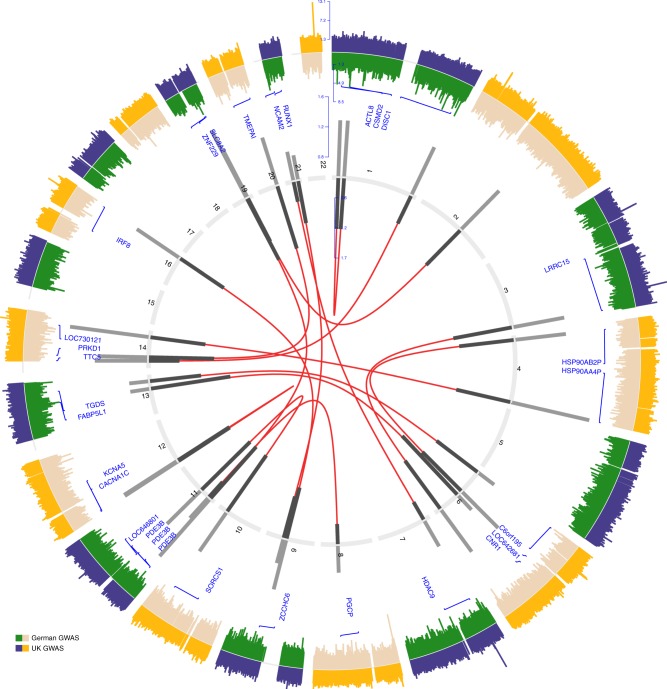
Fig. 1.
Interaction analysis identifies 16 unique risk loci pairs. Circos plot of genome-wide association and significant interaction results for the identified paired risk loci. The two outer most panels display results from genome-wide association study on a Manhattan plot for autosomal variants on a negative log transformed scale. Inner numbered panel represents the chromosomes and effect-sizes of significant interacting pairs are plotted on bar charts from both samples (dark: German sample; light: UK sample). Interacting pairs are line joined in the inner most panel based on their chromosomal positions (NCBI build 19 human genome). Annotations of single-nucleotide polymorphisms to gene ids are displayed on the inner manhattan plot

