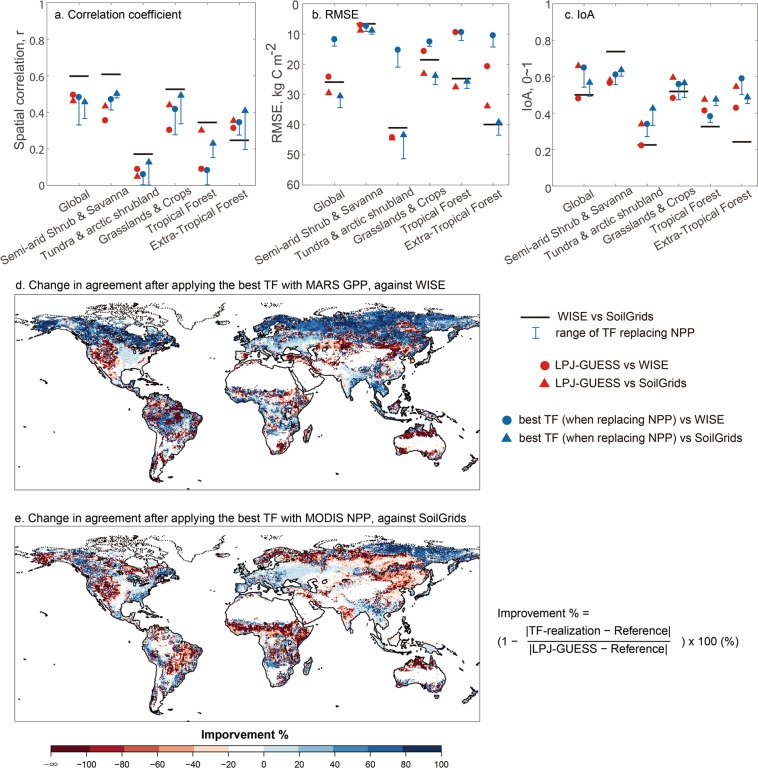
Figure 3.
Comparison of spatial soil carbon (representing 2000s) with two independent contemporary empirical datasets (panel a–c) over six land cover classes (Supplementary Fig. S2). Black line segments show the comparison between two empirical datasets of soil carbon. Output from LPJ-GUESS simulation before replacing NPP is marked as red. TF-realizations by replacing simulated NPP with the refined NPP derived from MODIS NPP and FLUXCOM GPP are marked as blue. Error bars show the range of results from replacing simulated NPP with the five refined NPP. Panel d and e show improvement of the best TF-realizations (using FLUXCOM MARS GPP and MODIS NPP) in magnitude for soil carbon comparing to WISE and SoilGrids at 2 m depth, respectively.

