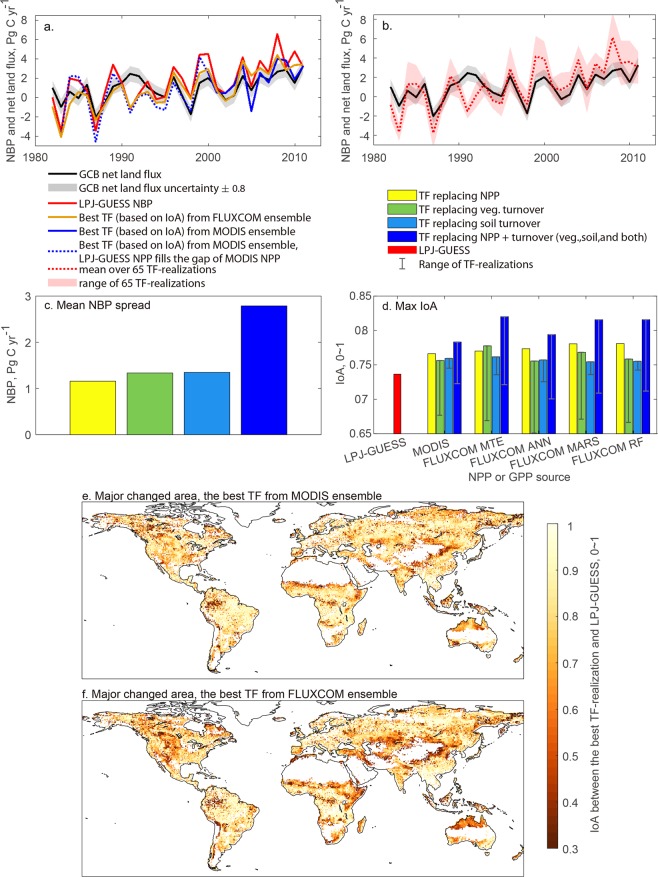
Figure 4.
Global annual net land flux and NBP during 1982–2011. (a) lines show the temporal pattern of the net land flux derived from LPJ-GUESS (red), the best TF-realization (based on IoA) when using MODIS NPP to correct NPP and C turnover (blue), and the best TF-realization (based on IoA) when using FLUXCOM GPP to correct NPP and C turnover (orange). (b). The red shaded area shows the range of 65 TF-realizations (5 for replacing NPP only, 10 for replacing vegetation turnover, 10 for replacing soil turnover, and 40 for replacing NPP and turnover, including vegetation, soil and both turnovers). The net land flux from GCB in (a,b) is shown in black lines with ± 0.8 Pg C uncertainty range (grey shaded area). (c) shows the NBP spread that arises from correction of NPP, vegetation turnover, soil turnover, and the combination of them. (d) Bars show maximum IoA when comparing TF-realizations to GCB data in four categories: replacing NPP only (yellow), replacing vegetation turnover only (green), replacing soil turnover only (light blue) and replacing NPP and turnover (dark blue). The error bars show the range for each category TF-realizations. The red bar shows the fully dynamic simulation. All the three statistical evaluation metrics can be found in Supplementary Fig. S6. (e,f) the dark red area (low IoA) shows the major area of change when applying the best TF-realization using MODIS NPP and FLUXCOM GPP, respectively, in comparison with the fully dynamic LPJ-GUESS simulation.

