Fig. 9.
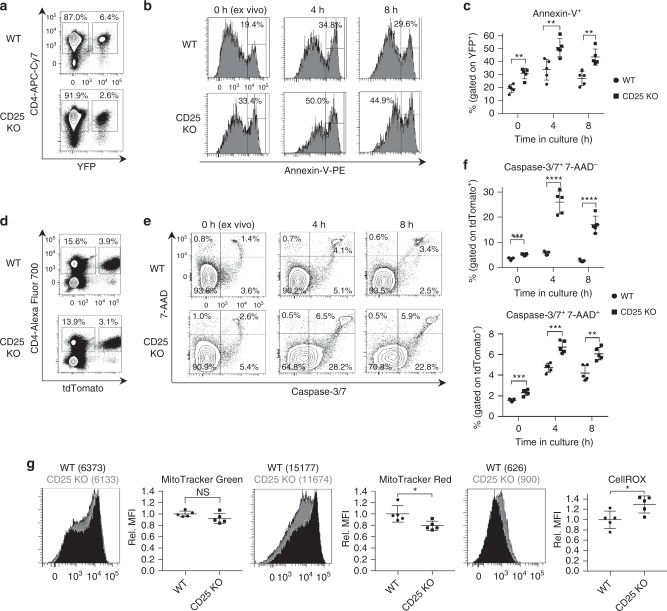
Increased apoptosis and mitochondrial dysfunction in CD25-deficient peripheral Tregs. a Representative contour plots and gating strategy for YFP+ Tregs among splenic CD4+ T cells bead-purified from CD25flox/Foxp3eGFP-Cre-ERT2/R26Y mice (shown as CD25 KO) and reporter controls 10–14 days after tamoxifen induction. b Representative histograms and (c) scatter plot showing Annexin-V staining, performed ex vivo and after 4 h and 8 h incubation in culture media alone (n = 5 mice per group). Cells are gated on the YFP+ population shown in (a). d Representative contour plots and gating strategy for tdTomato+ Tregs among splenic CD4+ T cells from CD25flox/Foxp3eGFP-Cre-ERT2/R26TD mice (shown as CD25 KO) and reporter controls evaluated 10–14 days after tamoxifen induction. e Representative contour plots and (f) scatter plots showing staining with caspase-3/7 enzyme substrate and 7-AAD (n = 5 mice per group). Cells are gated on the tdTomato+ population shown in (d). g Representative histograms and scatter plots of MFI data for tdTomato+ cells stained with MitoTracker Green, MitoTracker Red, and CellROX oxidative stress detection reagent (n = 5 mice per group). Rel. MFI = relative MFI normalized to CD25 WT controls. Each symbol represents an individual mouse (mean ± SD). NS, not significant (p > 0.05), *p < 0.05, **p < 0.01, ***p < 0.001, ****p < 0.0001 (two-tailed Student’s t test). Data are representative of (a, b, d, e, g) or pooled from (c, f, g) two independent experiments

