Figure 2.

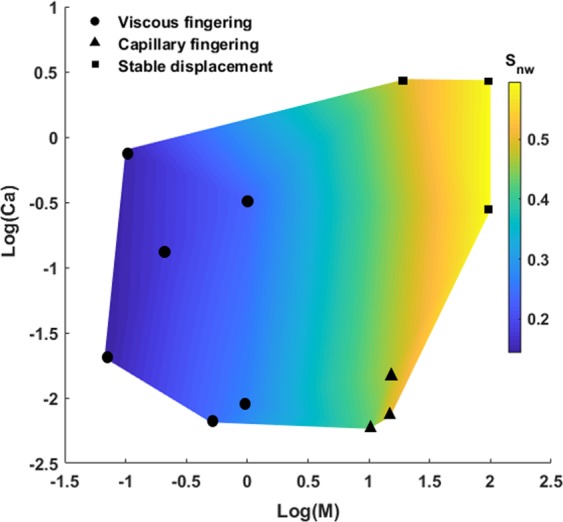
Phase diagram representing the displacement patterns and non-wetting phase saturation profile at breakthrough time as a function of viscosity ratio (M) and capillary number (Ca). The black dots indicates the simulation results.

Phase diagram representing the displacement patterns and non-wetting phase saturation profile at breakthrough time as a function of viscosity ratio (M) and capillary number (Ca). The black dots indicates the simulation results.