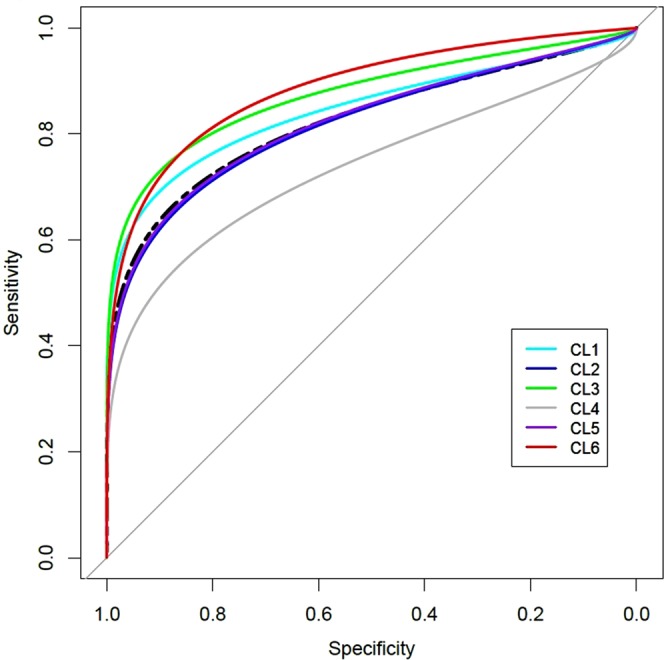
Figure 3.

Cluster-specific receive operating curve (ROC) plot of fasting glucose for screening incident diabetes. ROC plots for prediction performance of fasting glucose in the clusters and total population are depicted. The black dotted line is ROC of fasting glucose in the total population (AUC = 0.83). The color of ROCs represents each cluster. The cluster-specific AUC of fasting glucose is the highest in CL6 (AUC = 0.89), while the lowest in CL4 (AUC = 0.74). The AUC of CL1, CL2, CL3, and CL5 is 0.87, 0.82, 0.87 and 0.82, respectively. AUC: area under curve.
