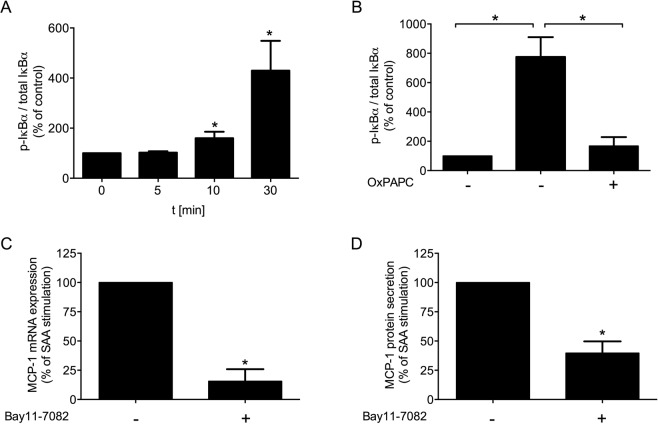
Figure 5.
Signalling pathway. (A,B) Ratio of p-IκBα to total IκBα upon rhSAA (1 µg/ml) stimulation for (A) 5, 10, 30 min and (B) 30 min in combination with OxPAPC (30 µg/ml). (C,D) MCP-1 mRNA expression and protein secretion upon rhSAA (1 µg/ml) in co-stimulation with NFκB inhibitor Bay11-7082 (5 µmol/l). (C) MCP-1 mRNA expression upon 4 h of stimulation. (D) MCP-1 protein secretion upon 24 h of stimulation. Data are presented as means ± SEM. *p < 0.05.

