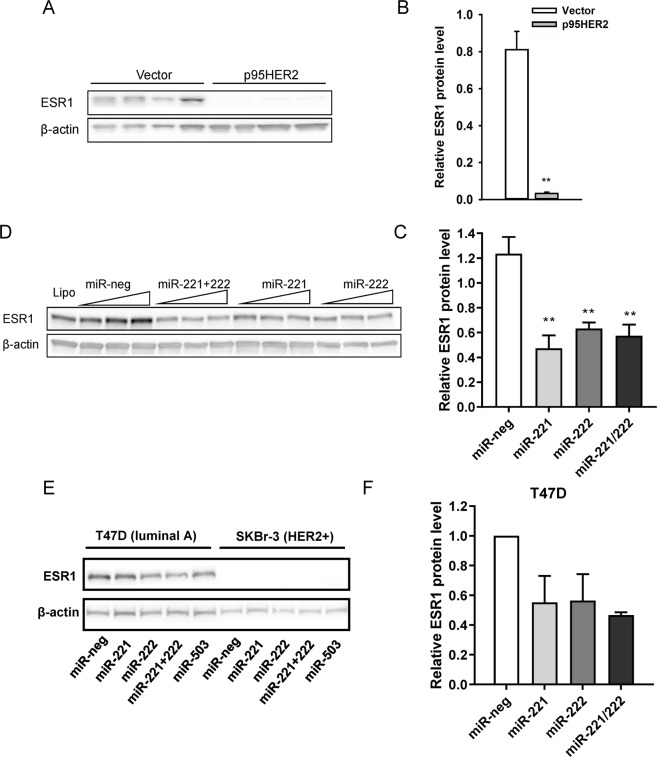
Figure 3.
Inhibition of ESR1 protein expression by p95HER2 and miR-221 and -222. (A,B) Vector- and p95HER2-expressing MCF-7 cells were lysed at time 48 h after induction, and subjected to Western blot analysis of ESR1 expression. β-actin is shown as a loading control. The graph shows summarized data as mean values with S.E.M. error bars of 4 independent, parallel experiments for each cell line, normalized to the β-actin loading control. **Significantly different from vector control, p < 0.01. (C,D) Immediately after induction, cells were transfected with miR-221, miR-222, or negative control miRNA mimics (20, 40 and 80 nM final concentrations respectively). 48 h later, cells were lysed and subjected to Western blot analysis of ESR1 expression. β-actin is shown as a loading control. The graph shows mean values from 40 nM transfections, with S.E.M. error bars of 5 independent, parallel experiments, normalized to the β-actin loading control. **Significantly different from negative control mimic, p < 0.01. (E,F) The representative blot shows T47D and SKBr-3 cells subjected to Western blot analysis of ESR1 expression. p150Glued is shown as a loading control. The graph shows mean values with S.E.M. error bars of 2 independent experiments for T47D cells, normalized to the β-actin loading control.

