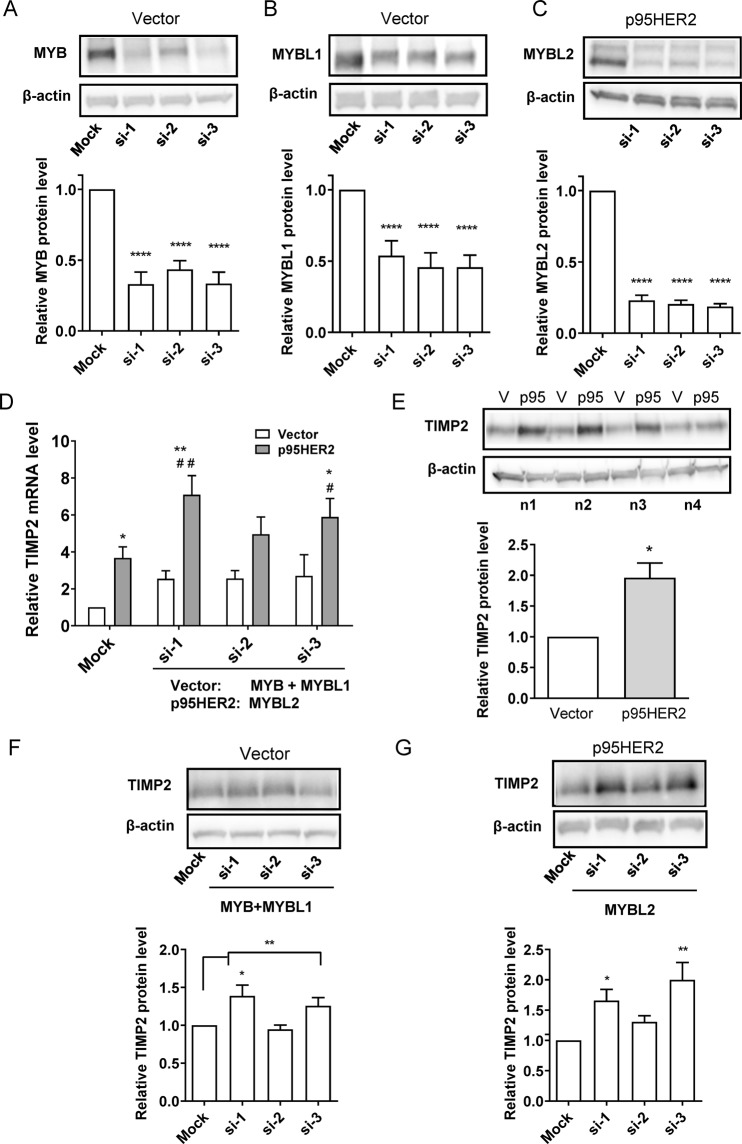
Figure 6.
Knockdown of MYB family proteins and p95HER2 upregulation increase TIMP2 expression in MCF-7 cells. (A–C) Relative protein level of MYB (A), MYBL1 (B) and MYBL2 (C) after knockdown of MYB and MYBL1 (vector cells) or MYBL2 (p95HER2 cells). 48 h after induction and transfection with the indicated siRNAs, cells were lysed and subjected to Western blotting. Representative blots are shown, with β-actin as loading control. Graphs are mean values with S.E.M. error bars, based on 6–7 independent replicates per condition. M: mock siRNA, si, s2, s3: three different siRNAs for each MYB. ****p < 0.0001, One-way ANOVA with Dunnet post-test. (D) qPCR analysis of the TIMP2 mRNA level in vector- and p95HER2 cells after knockdown of MYB and MYBL1 (vector cells) or MYBL2 (p95HER2 cells). Reference genes are GAPDH and β-actin. Data are means with S.E.M. error bars, of 3 independent experiments. ***Significantly different from the corresponding mean values in vector cells, p < 0.05 and 0.01, respectively. ###Significantly different from the corresponding mean values in mock-transfected p95HER2 cells, p < 0.05 and 0.01, respectively. (E) Relative TIMP2 protein level is increased by p95HER2 expression in MCF-7 cells. The graph shows mean values with S.E.M. error bars, of 3 independent experiments. *Significantly different from the value in vector cells, p < 0.05. (F,G) Relative TIMP2 protein level is increased after knockdown of MYB and MYBL1 (vector cells) or MYBL2 (p95HER2 cells). ***Significantly different from the corresponding mean values in mock-transfected cells, p < 0.05 and 0.01, respectively.

