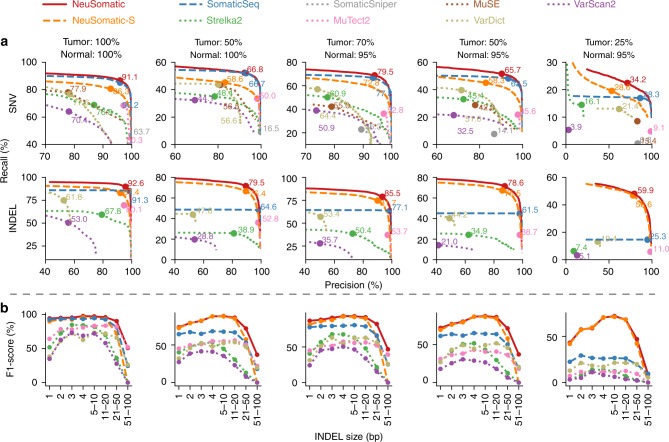
Fig. 4.
Performance analysis of the DREAM Stage 4 dataset. In this dataset, five tumor and normal purity scenarios (100% T:100% N, 50% T:100% N, 70% T:95% N, 50% T:95% N, and 25% T:95% N) are used. a Precision-recall analysis: the confidence or quality scores are used to derive the precision-recall curves. The highest F1-score achieved by each algorithm is printed on the curve and marked with a solid circle. b Performance analysis of INDEL accuracy (F1-score) for different INDEL sizes

