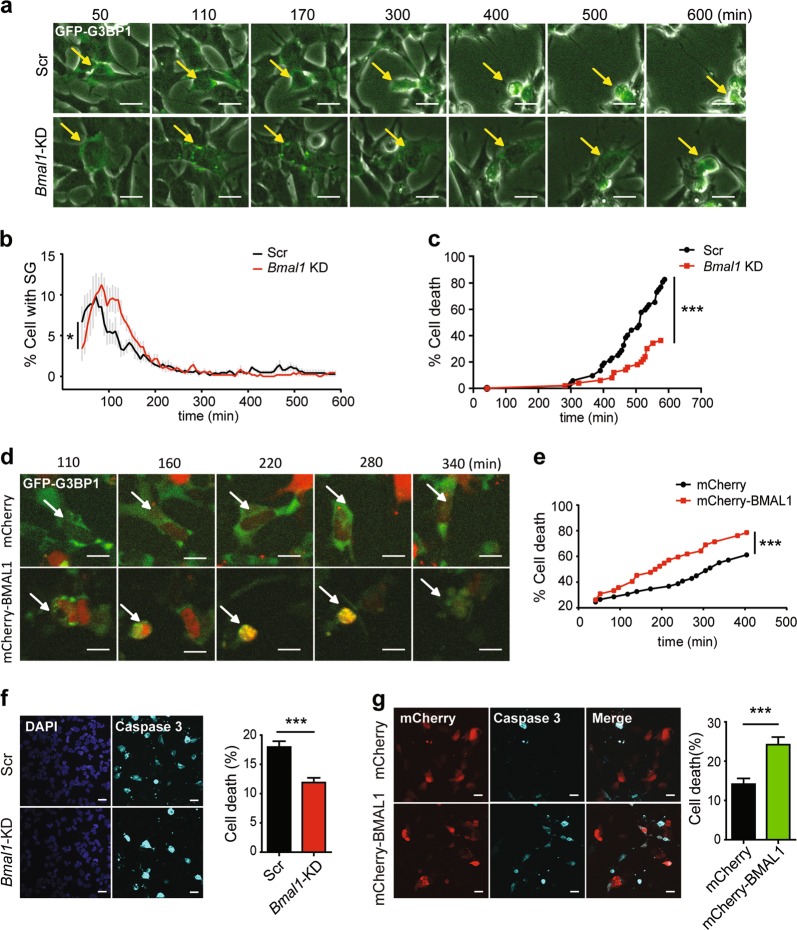
Fig. 4. Reduced expression of BMAL1 protects against stress-induced cell apoptosis.
a Live-cell imaging of Bmal1-silenced GFP-G3BP1 knock-in (KI) cells exposed to 20 μM of sodium arsenite for up to 600 min (see Movie S1, 2). The same stress granule-generating cell in each group (Scr or Bmal1 knockdown (KD)) at different time was indicated by an arrow. Note the different timing of the apoptotic morphology (rounded cell shape and detachment from the dish) in cells transfected with Scr or Bmal1 small interfering RNA (siRNA). b Quantification of the percentage of cells with stress granules (mean ± S.E.M.; n = 500–600 cells per sample, *P ≤ 0.05 by two-way analysis of variance (ANOVA). Scale bar = 20 μm). c The death ratio of stress granule-positive cells (n = 50–100 cells per group, ***P ≤ 0.0001 by log-rank test). d Live-cell imaging of mCherry-BMAL1-expressing GFP-G3BP1 KI cells exposed to 20 μM of sodium arsenite (see Movie S3, 4). e The cell death ratio of mCherry- and stress granule-positive cell, ***P ≤ 0.0001 by log-rank test. f, g Caspase-3 activation in GFP-G3BP1 KI cells transfected with Bmal1 siRNA (f) or mCherry-BMAL1 expression plasmid (g). At 72 h after siRNA transfection, cells were treated with 50 μM SA for 12 h before analysis. For cells with mCherry-BMAL1 overexpression, they were treated 48 h post transfection with 20 μM SA for 7 h before analysis. Representative images of activated caspase-3 staining and the quantification of percentage of cell death as indicated by activated caspase-3 are shown for each condition (mean ± S.E.M.; n = 3 independent experiments, with 10 fields scored per experiment, each field >100 cells, ***P ≤ 0.001 by unpaired Student’s-t-test. Scale bar = 20 μm)

