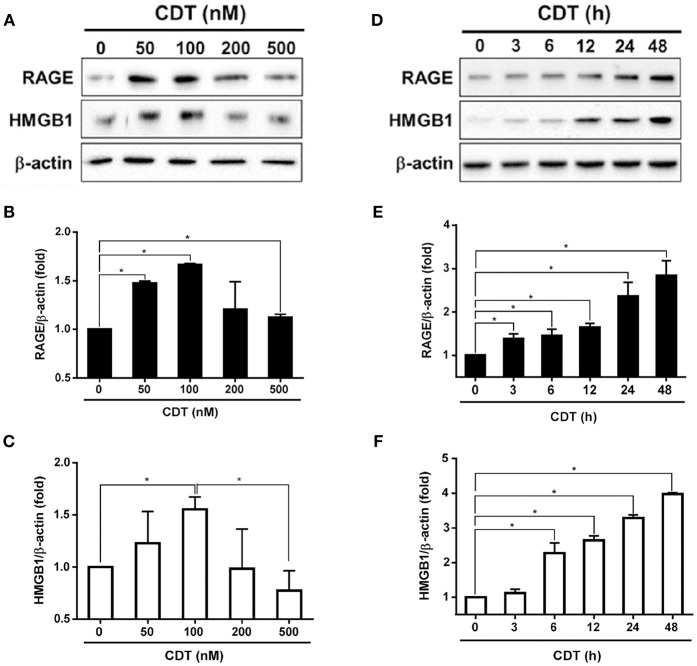
Figure 1.
CDT induces RAGE and HMGB1 expression. (A) AGS cells were exposed to CDT for 24 h at various concentrations (0–500 nM), and (B) treated with 100 nM CDT at different time points (0–48 h). Total cell lysates were prepared to measure the expression of RAGE and HMGB1 by western blotting, and β-actin was used as the protein loading control. Protein expression levels of RAGE and HMGB1 were quantified by densitometric analysis and normalized to β-actin, respectively (B–F). The data are presented as means ± standard deviations for three independent experiments. Statistical analysis was calculated using ANOVA analysis and Tukey's test. *P < 0.05 was considered statistically significant.

