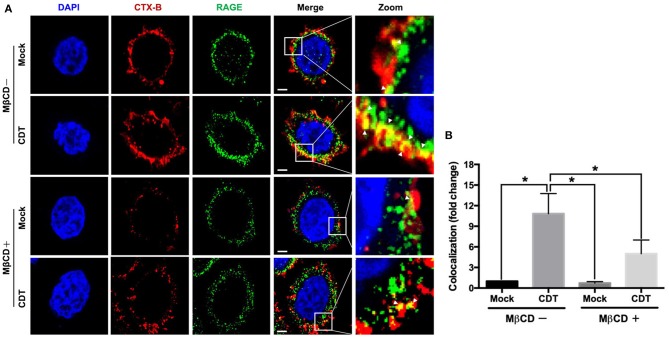
Figure 3.
Recruitment of RAGE into lipid rafts by CDT. (A) AGS cells were pretreated with or without 5 mM MβCD followed by incubation with 100 nM CDT for 24 h. Cells were fixed and probed with DAPI (blue) to visualize the nucleus, Alexa Fluor 555-conjugated cholera toxin subunit B (CTX-B) to visualize GM1 (red), and an antibody against RAGE (green). Arrows indicated the colocalization (yellow) of CTX-B and RAGE in the overlay. The magnified images were shown in the right panels. Bars, 5 μm. (B) The fluorescence intensity of CTX-B and RAGE was analyzed by ZEN software (Carl Zeiss). Colocalized punctate of CTX-B and RAGE were quantified using merged pixels and normalized to those in the mock-control group. Statistical analysis was calculated using ANOVA analysis and Tukey's test. *P < 0.05 was considered statistically significant.

