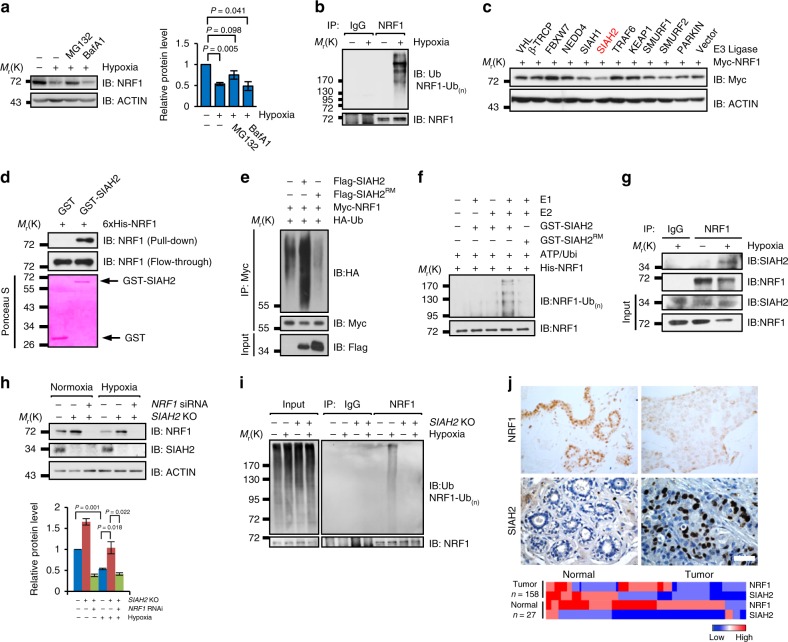
Fig. 3.
SIAH2 promotes NRF1 polyubiquitination and degradation under hypoxia. a Hypoxia-mediated NRF1 degradation is inhibited by the proteasomal inhibitor MG132, but not by the autophagy inhibitor Bafilomycin A1 (BafA1). Right: densitometric quantification of NRF1 expressions. b MDA-MB-231 cells were incubated under normoxia or hypoxia for 24 h. Cells were treated with 10 µM MG132 for 6 h before harvesting. Cell lysates were immunoprecipitated with anti-NRF1 antibodies and then detected by western blotting with anti-NRF1 and anti-Ubiquitin antibodies. c Hypoxia-related ubiquitin E3 ligases were transiently co-transfected with Myc-NRF1 into HeLa cells for 24 h, and Myc-NRF1 protein levels were detected by western blotting with anti-Myc antibodies. d Direct interactions between bacterially expressed His-NRF1 and GST-SIAH2 in vitro. e Ectopic expression of SIAH2, but not SIAH2RM increased NRF1 ubiquitination in vivo. f Ubiquitination of bacterially expressed His-NRF1 by purified SIAH2 but not by SIAH2RM in vitro. g MDA-MB-231 cells were cultured under normoxia or hypoxia for 18 h, then treated with 10 µM MG132 and incubated under normoxia or hypoxia for another 6 h. Endogenous interactions between NRF1 and SIAH2 were analyzed by immunoprecipitation. h Wild-type or SIAH2−/− MDA-MB-231 cells were transiently transfected with scramble or NRF1-targeted siRNA, and then cultured under normoxia or hypoxia for 36 h. Cells were harvested and analyzed by western blotting. Bottom: densitometric quantification of the indicated proteins. i Hypoxia-induced ubiquitination of NRF1 is abolished by depletion of SIAH2 in vivo. j Top: representative immunohistochemical staining of NRF1 and SIAH2 in normal breast tissue and breast cancer tissue from the tissue microarray. (Brown color indicates positive immune reaction; scale bars, 50 µm). Bottom: heat map showing quantitative analysis of the expression of NRF1 and SIAH2 proteins in normal breast tissues and breast cancer tissues. n = 158 breast tumors and n = 27 normal breast samples. Statistical analysis of the immunostaining results is shown in Supplementary Table 3, 4. For all panels, error bars indicate s.d., n = 3 biological replicates. Data were compared with two-tailed paired ratio t-tests

