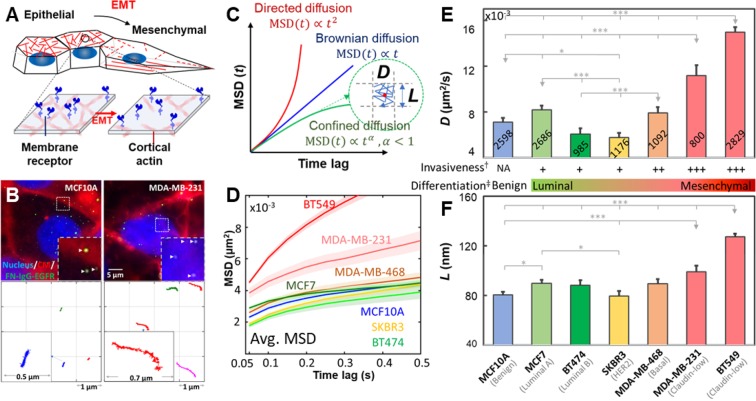
Figure 1.
TReD, a new biophysical phenotyping method to assess metastasis. (A) Schematic shows the hypothetical effect of EMT on the EGFR dynamics. (B) Images of living cells and fluorescently labeled EGFRs (FN-IgG-EGFRs). The representative FN-IgG-EGFR trajectories shown in the lower panel were derived from the EGFRs pinpointed by the arrowheads. Individual trajectories were color-coded for identification. These trajectories were reconstructed from 60 seconds time-series images acquired in MCF10A and MDA-MB-231 cells. The insets are the zoom-in of trajectories. (C) The diffusivity of EGFR (D) and the linear size of the EGFR confinement (L) can be extracted from trajectories using a modified MSD fitting algorithm. (D) Averaged-MSD curves from 800–2,800 trajectories acquired in the seven breast epithelial cell lines. The solid line and the ribbon represent mean value and standard error of the mean, respectively. (E,F) Characterization of EGFR diffusivity (D) and compartment size (L) among these seven breast cell lines. More invasive breast cancer cell lines exhibit higher EGFR diffusivities and larger compartment sizes. The number of trajectories collected from each cell line is shown on each bar. Statistical comparison was performed using unpaired t-test., where the asterisk represents statistical significance: ***p < 0.001, **p < 0.01, *p < 0.05. The error bar represents the standard error of the mean. †In vitro invasiveness was derived from Lin’s report22. ‡Luminal differentiation scores of breast cancer cells were derived from the Perou23 and the Partanen24 reports.

