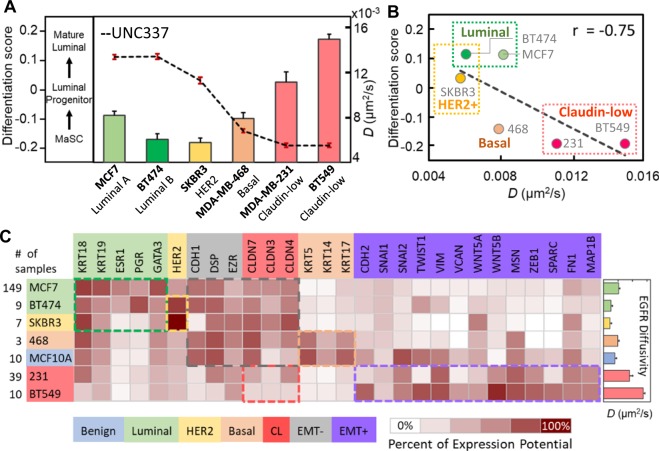
Figure 2.
Correlation between TReD and molecular signature. (A) EGFR diffusivity versus luminal differentiation score. The luminal differentiation scores, as calculated on the basis of UNC337 gene expression database, represent the differentiation potentials of breast cells in a luminal epithelial differentiation lineage from mammary stem cells (MaSCs) to the luminal progenitor cells, and eventually to mature luminal cells. (B) The negative correlation between EGFR diffusivity and luminal differentiation score was seen, with the Pearson correlation coefficient r = −0.75. (C) Heat map generated from Genevestigator, showing the expression potential of the 28 genes related to EMT and the five breast cancer cell subtypes (luminal A, luminal B, HER2-rich, basal, and claudin-low). The highly invasive cancer cells exhibit features of mesenchymal cells. As higher EGFR diffusivities were observed in the highly invasive cells (MDA-MB-231 and BT549), we speculated that the EMT might alter the EGFR dynamics. Each cell subtype and the corresponding biomarkers have the same color code, and the colored boxes highlight the differences in molecular signatures among these seven cell lines. The CLDN genes are the biomarkers for claudin-low cells but also the EMT-downregulated genes.

