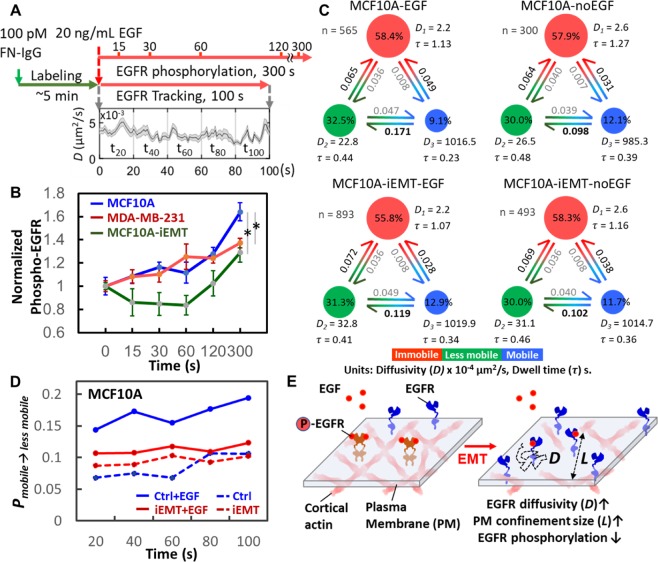
Figure 6.
Relaxation of EGFR confinement reduced EGF-induced EGFR phosphorylation. (A) Procedure to evaluate the connection between EGFR dynamics and EGFR phosphorylation. For EGFR phosphorylation, cells were stimulated with or without EGF (t = 0 s), and the phosphorylation was measured at different time points. EGFR tracking was immediately initiated after the addition of cell culture medium containing EGF. The plot shows the time trace of EGFR diffusivity. (B) EGF-stimulated EGFR phosphorylation in MCF10A, EMT-induced MCF10A, and MDA-MB-231 cells. Three trials were conducted. In each trial, 4 data points were collected at one time point. Statistical comparison was performed using unpaired t-test, where the asterisk represents statistical significance: *p < 0.05. The error bar represents the standard error of the mean. (C) vbSPT analysis revealed the dynamics of EGFRs in MCF10A cell under the perturbation of EMT-induction or EGF-stimulation. The three diffusive states are defined as immobilization (red), less mobile (green), and mobile (blue).Transition probabilities, state occupancies, average dwell time (τ), and number of trajectories analyzed are shown in each subplot. (D) The transition probability from the mobile to the less mobile (PMobile→Less mobile). Trajectories were truncated into five time windows and analyzed by vbSPT to reveal the changes of PMobile→Less mobile every 20 s. (E) Schematic shows our hypothesis of the effect of EMT on the dynamics of EGFRs and EGFR phosphorylation.

