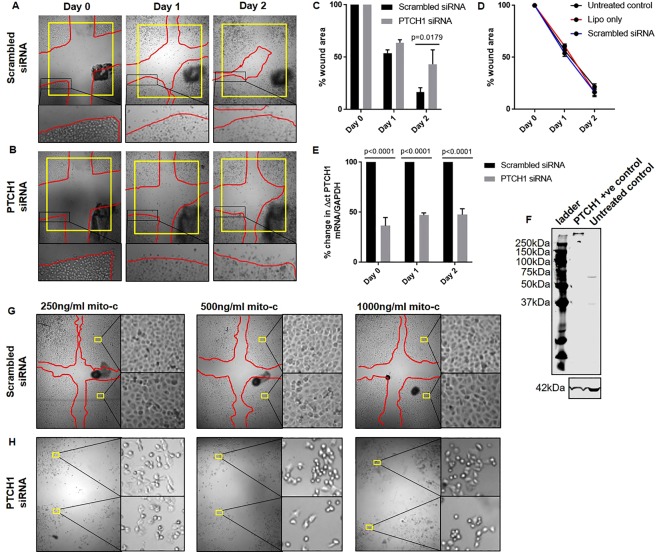
Figure 4.
PTCH1 expression regulates cell proliferation and adhesion. Representative images of cross-hatched wounds in (A) scrambled siRNA- or (B) PTCH1 siRNA-treated 1HAE0 cells imaged at day 0, 1 and 2 post-injury were shown. Red line indicated the wound edge boundary. Yellow box standardized the area of field. Black dots indicated pen marks of the same representative wound images taken over time. (C) Wound area remaining in scrambled siRNA- or PTCH1 siRNA-treated cells was expressed as a percentage of the total area measured at day 0 in each individual wound. (D) Wound area remaining in untreated controls, lipofectamine (lipo)- and scrambled siRNA-treated cells was expressed as a percentage of the total area measured at day 0 in each individual wound. E) PTCH1 mRNA expression in scrambled siRNA- and PTCH1 siRNA-treated cells was normalized to 100% scrambled siRNA-treated cells for each time point. Values were expressed as mean ± SEM (N = 3–4 independent experiments). Two-way analysis of variance with Bonferroni’s multiple comparisons test was used in panel C,D. (F) Representative protein blot showing PTCH1 antibody expression and specificity in PTCH1-overexpressing lysate and untreated human airway epithelial cell lysate. Cell morphology was imaged 24 h post mitomycin C treatment in (G) scrambled siRNA- or (H) PTCH1 siRNA-treated cells. Yellow boxes indicated 2 magnified regions in each condition. Red line indicated the wound edge boundary 24 h post injury showing normal wound closing ability in scrambled siRNA-treated cells.

