Fig. 5.
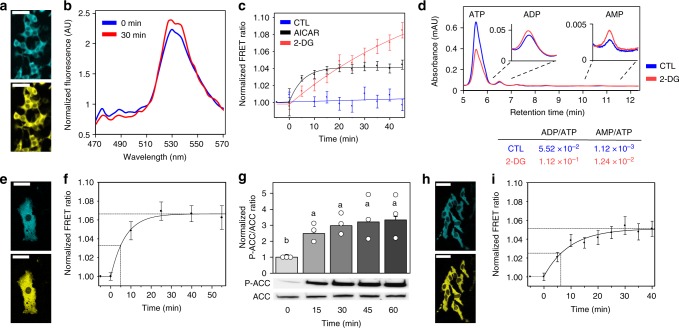
AMPfret in cellulo. a–d HEK293T cells transfected with AMPfret 2.1. a Micrograph of CFP and YFP channels (scale bars: 50 µm). b Fluorescence emission spectra before (0 min, blue) and after addition (30 min, red) of 1 mM AICAR, showing increase at 527 nm (cpVenus) and decrease at 478 nm (mseCFP∆11) over 30 min. c Normalized AMPfret FRET signal variation (YFP fluorescence at 530 ± 5 nm/CFP fluorescence at 478 ± 5 nm) after incubation with 1 mM AICAR (black), 20 mM 2-DG (red) or complete medium (control CTL, blue). Data of cell population normalized to values before treatment. Data and error bars represent mean ± SEM (n = 64, n = 27, and n = 39 cells from at least two independent experiments for 2-DG, AICAR, and control, respectively). d HPLC quantification of adenylates in HEK293T cells treated for 50 min with complete medium (control CTL, blue) or 20 mM 2-DG medium (red). Curve (average of three-independent experiments) showing peaks with typical retention times of 5.5 min (ATP), 6.5 min (ADP) and 10.8 min (AMP), and adenylate ratios calculated thereof (same color code). e–g 3T3-L1 cells transfected with AMPfret 2.1. e Micrograph of CFP and YFP channels (scale bars: 50 µm). f Normalized AMPfret FRET signal variation after incubation with 1 mM AICAR. Data of cell population normalized to values before AICAR addition. Data and error bars represent mean ± SEM (n = 9 cells of two-independent experiments). g AICAR-dependent activation of AMPK verified by parallel immunoblots for P-ACC and ACC (lower panel) and their quantification (upper panel). Data and error bars represent mean ± SEM (n = 3). After checking normality and equality of variance, statistical significance was analysed by one-way ANOVA followed by Bonferroni multiple comparison. Means sharing the same letter do not differ significantly (p ≤ 0.02). h, i HeLa cells transfected with AMPfret 2.1. h Micrograph of CFP and YFP channels (scale bars: 50 µm). i Normalized AMPfret FRET signal variation after incubation with 1 mM AICAR. Data of cell population normalized to values before AICAR addition. Data and error bars represent mean ± SEM (n = 51 cells of three-independent experiments)

