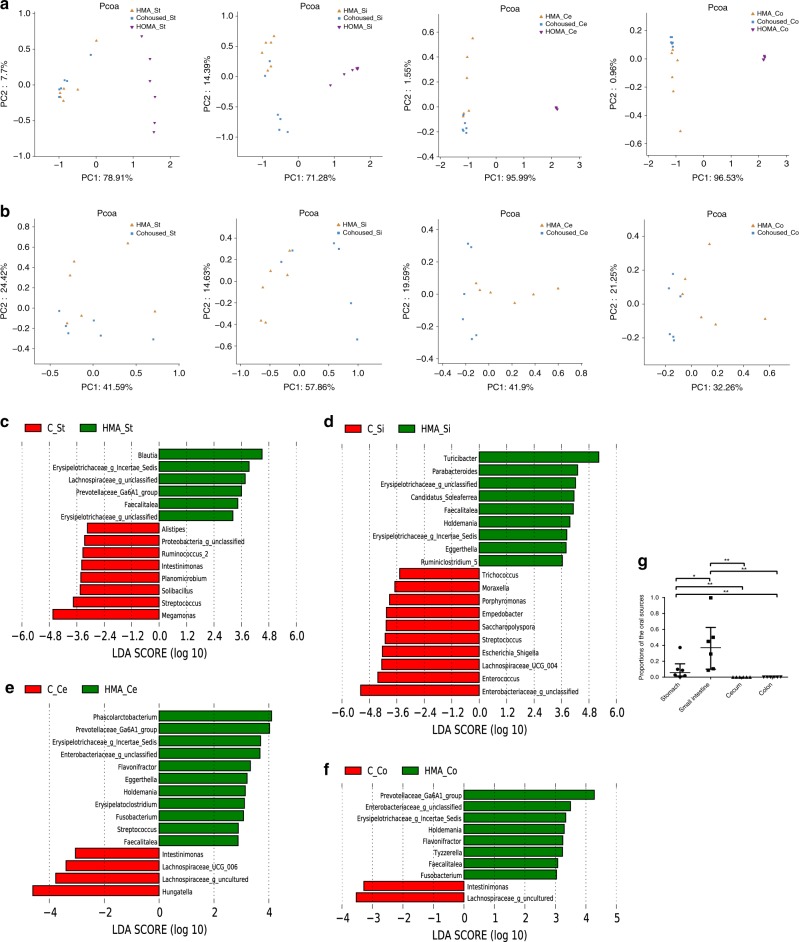
Fig. 4.
The shift in microbial composition after cohousing. a PCoA score plot of the microbiota from each gut segment of HOMA mice, HMA mice and cohoused mice. b PCoA score plot of the microbiota from each gut segment from HMA mice and cohoused mice. c HMA mouse-enriched genus-level taxa in the stomach are indicated by a positive LDA score (green), while the cohoused (C) mouse-enriched taxa have a negative LDA score (red). d The HMA mouse-enriched genus-level taxa in the small intestine are indicated by a positive LDA score (green), while the cohoused mouse-enriched taxa have a negative LDA score (red). e The HMA mouse-enriched genus-level taxa in the caecum are indicated by a positive LDA score (green), while the cohoused mouse-enriched taxa have a negative LDA score (red). f The HMA mouse-enriched genus-level taxa in the colon are indicated by a positive LDA score (green), while the cohoused mouse-enriched taxa have a negative LDA score (red). g Microbial Source Tracker analysis showed the proportions of the different sources present in the microbiota of the cohoused mice in each gut segment. The Kruskal–Wallis test was used to compare the proportions of the oral sources present in each gut segment of the cohoused mice (*P < 0.05, **P < 0.01)

