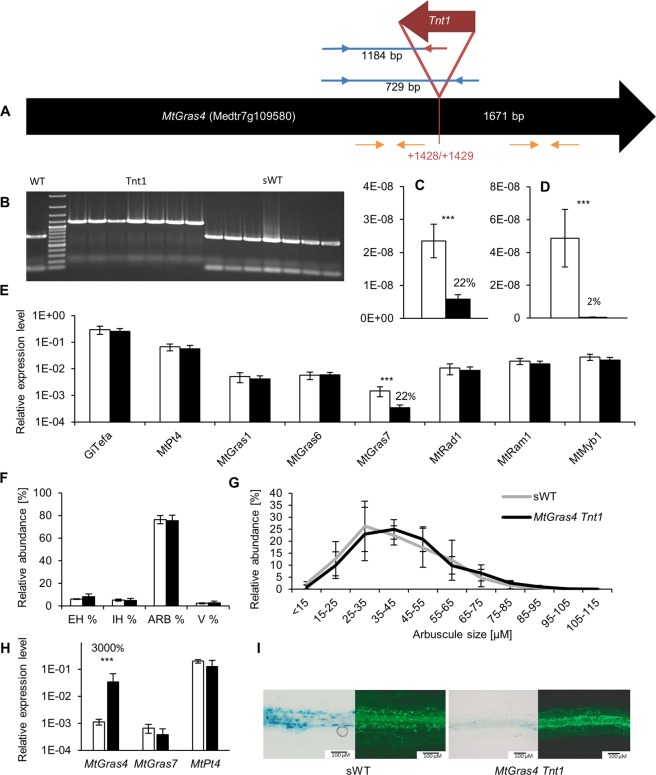
Figure 6.
Molecular and phenotypical analysis of the MtGras4 Tnt1 insertion-carrying line NF4813. (A) Schematic illustration of the Tnt1 insertion site (red), primer position for genomic PCR-amplification (blue and red arrows), and position of real-time RT-PCR primers (orange) in the exon of MtGras4 (black). (B) Leaf disc multiplex PCR identification of homozygous, MtGras4 Tnt1 insertion-carrying NF4813 (Tnt1), MtGras4-segregating NF4813 wild type (sWT), and R108 wild type (WT) plants. A 50 bp DNA ladder shown as standard. A full-length gel is presented in Supplementary Fig. S4. (C,D) Relative amount of MtGras4 transcript regions located 5′ (C) and 3′ (D) of the Tnt1 insertion. (E) Relative expression of selected genes in homozygous MtGras4 Tnt1 mutant (black) and segregating wild type plants (white). Transcript amounts are shown relative to MtTefα expression. Roots were harvested at 35 dpi with R. irregularis. n = 8 biological replicates, error bars represent standard deviations. Numbers indicate the percental expression level compared to control roots. (F) Quantification of fungal structures in homozygous, MtGras4 Tnt1 mutant (black) and segregating wild type plants (white). Roots were harvested at 42 dpi with R. irregularis. Root systems were grouped into four biological replicates each containing a pool of four roots. Standard deviations are indicated as error bars. EH = External hyphae only; IH = Internal Hyphae only; Arb = arbuscules; V = Vesicles (no arbuscules). (G) Distribution of arbuscule sizes in mycorrhized homozygous MtGras4 Tnt1 mutant and segregating wild type plants. Sizes were measured from 1696 arbuscules in MtGras4 Tnt1 mutant (black) and 1207 arbuscules in segregating wild type plants (grey). Roots were harvested at 42 dpi with R. irregularis. Root systems were grouped into four biological replicates each containing a pool of two roots. Standard deviations are indicated as error bars. (H) Quantification of MtGras4, MtGras7, and MtPt4 in a homozygous MtGras4 Tnt1 mutant complemented with a −1206/+2086 genomic region of the M. truncatula A17 MtGras4 gene (black), and empty vector control roots (white). N = 6 biological replicates, error bars represent standard deviations. Numbers indicate percental expression levels compared to control roots. (I) Comparison of pMtGras7-gusAint activity in mycorrhizal roots of homozygous MtGras4 Tnt1 mutant and the corresponding segregating wild type (sWT) plants. GUS stainings were performed for 8 hours. Alexa WGA Fluor 488 stainings visualize AM fungal colonization. ***p < 0.001 (Student’s t-test).

