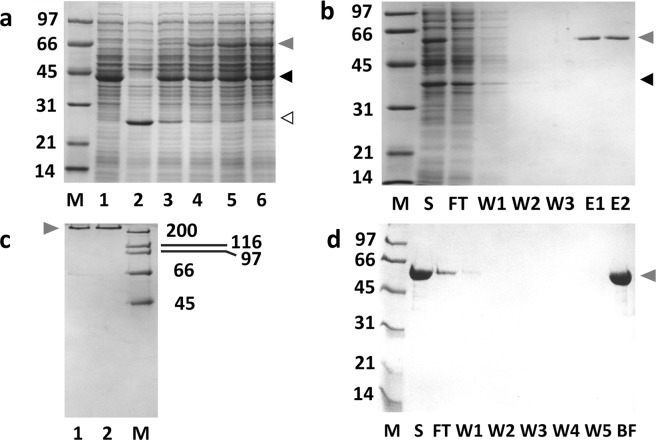
Figure 4.
Formation of M18-L-ST·SC-L-DBD with excess SC-L-DBD in the reaction mix and the preparation of the M18-L-ST·SC-L-DBD matrix (a) Kinetics of M18-L-ST·SC-L-DBD formation. Samples were analyzed by SDS-PAGE. Lane 1 is the soluble fraction containing SC-L-DBD. Lane 2 is the soluble fraction containing M18-L-ST. Lanes 3–6 represent the reaction mixtures that were post-mixed for 5 minutes, 90 minutes, 3 hours and overnight, respectively. (b) Biotin agarose column chromatography of the reaction mix. (c) SDS-PAGE analysis of the tetrameric state of M18-L-ST·SC-L-DBD complexes. Elution fractions (E1 and E2 in panel b) from the biotin agarose column were pooled and dialyzed against PBS. Lanes 1 and 2 show the purified M18-L-ST·SC-L-DBD complexes in the absence and presence of biotin, respectively. Samples in this panel (except the high molecular weight markers) were not boiled. (d) Binding of the elution fractions from biotin agarose column (panel b) to Sephadex G-100. Elution fractions were pooled, concentrated, dialyzed against PBS and applied to a column of Sephadex G-100. Fractions were analyzed by SDS-PAGE. Samples in panels a, b and d were boiled before gel loading. M, molecular weight markers (sizes in kDa); S, sample; FT, flow-through fraction; W, wash fractions; (E) elution fractions; BF, bound fraction. Open arrowhead, M18-L-ST; Black closed arrowhead, SC-L-DBD; Grey closed arrowhead, M18-L-ST·SC-L-DBD. Gel profiles shown in panels a–d are from different gels.

