Fig. 2.
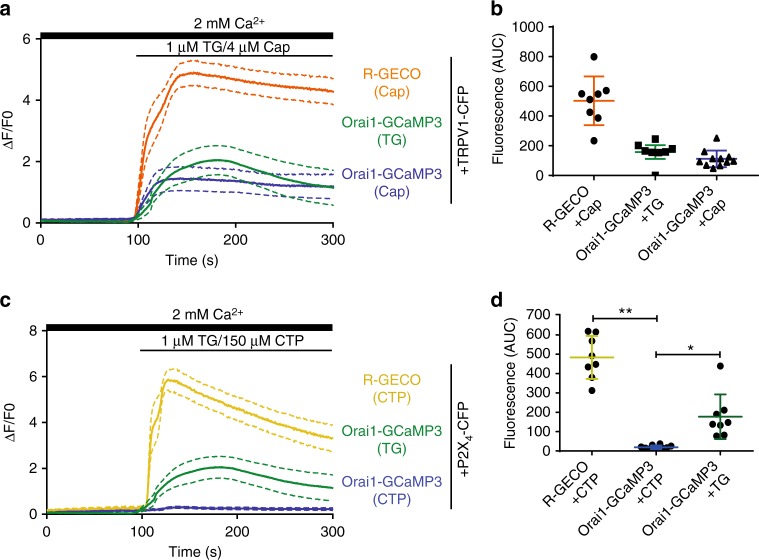
Orai1-GCaMP3 senses local calcium increments through TRPV1 but not through P2X4. a Calcium increments reported by R-GECO when the cells were exposed to capsaicin, Orai1-GCaMP3 with capsaicin and Orai1-GCaMP3 with thapsigargin (TG) from at least 12 independent transfections. b Area under the curve (AUC) for fluorescence of R-GECO with capsaicin (orange), Orai1-GCaMP3 with capsaicin (blue), and Orai1-GCaMP3 with TG (green). c Calcium increments reported by R-GECO when the cells were exposed to CTP, Orai1-GCaMP3 with CTP, and Orai1-GCaMP3 with thapsigargin (TG). d Area under the curve (AUC) for fluorescence of R-GECO with CTP (yellow, n = 8), Orai1-GCaMP3 with CTP (blue, n = 10), and Orai1-GCaMP3 with TG (green, n = 8). Notice that Orai1-GCaMP3 does not sense calcium increments with CTP while the R-GECO reports large calcium increments. In all cases, data shows the mean ± s.e.m. **p < 0.01, *p < 0.05. The statistical significance was p < 0.05. Statistics was performed by one-way ANOVA with Tukey’s post hoc test

